Question:
Linear Functions Fit to Data MC The table compares the
Last updated: 4/24/2023
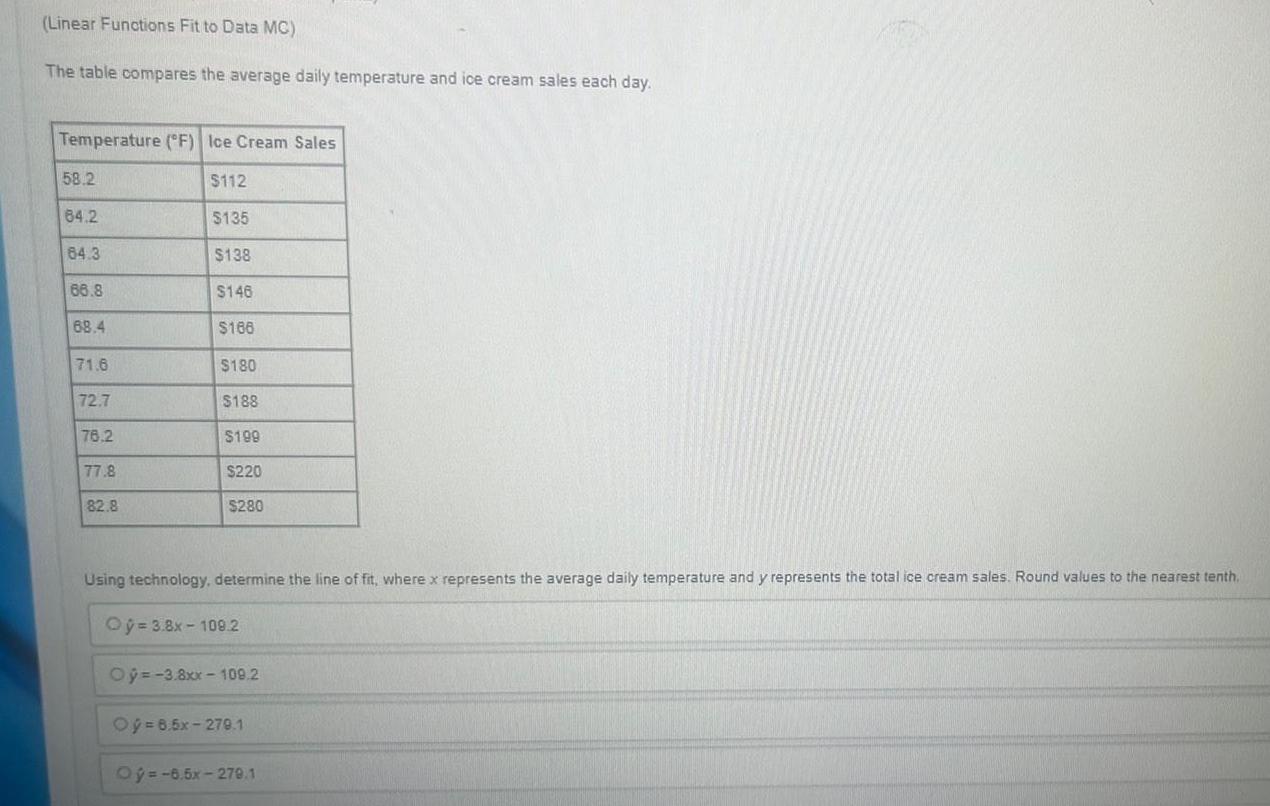
Linear Functions Fit to Data MC The table compares the average daily temperature and ice cream sales each day Temperature F Ice Cream Sales 112 58 2 64 2 64 3 66 8 68 4 71 6 72 7 76 2 77 8 82 8 135 138 146 166 180 188 199 220 280 Using technology determine the line of fit where x represents the average daily temperature and y represents the total ice cream sales Round values to the nearest tenth O 3 8x 10⁹ 2 Oy 3 8xx 109 2 Oy 8 5x 279 1 Oy 6 5x 279 1