comes to playing basketball and tall people are more
Last updated: 2/2/2024

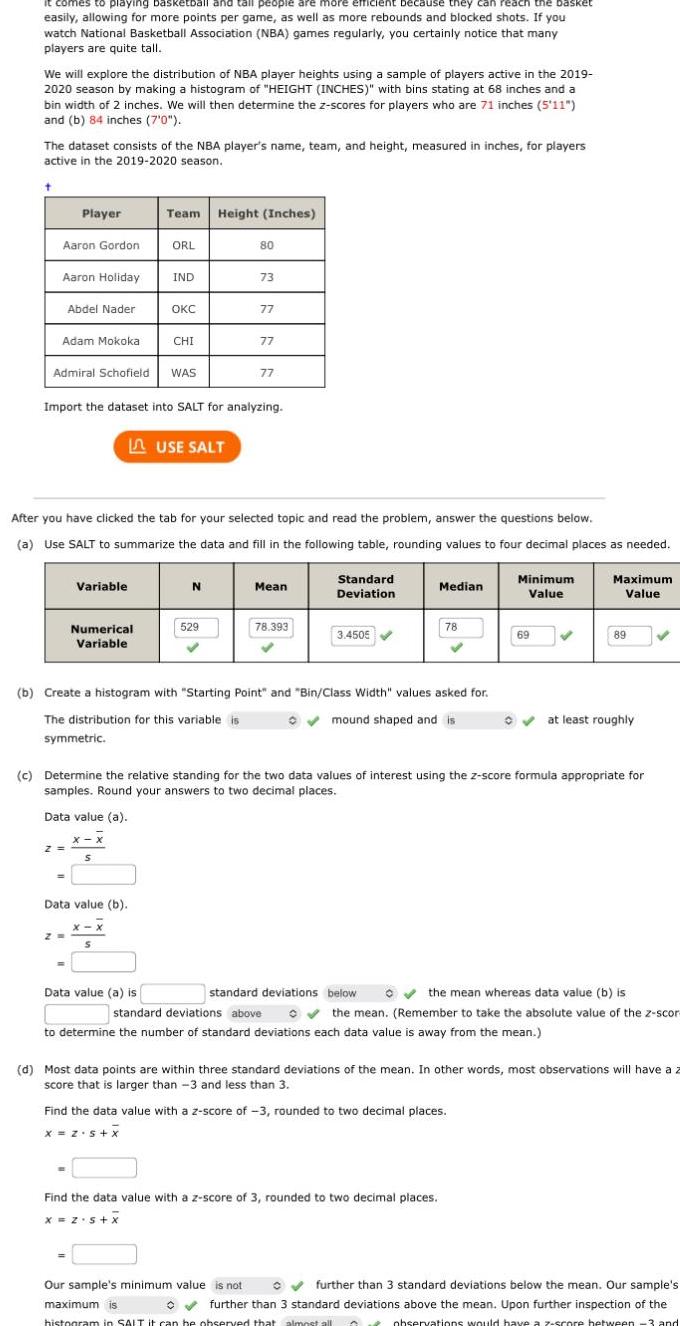
comes to playing basketball and tall people are more efficient because they can ch the basket easily allowing for more points per game as well as more rebounds and blocked shots If you watch National Basketball Association NBA games regularly you certainly notice that many players are quite tall We will explore the distribution of NBA player heights using a sample of players active in the 2019 2020 season by making a histogram of HEIGHT INCHES with bins stating at 68 inches and bin width of 2 inches We will then determine the z scores for players who are 71 inches 5 11 and b 84 inches 7 0 The dataset consists of the NBA player s name team and height measured in inches for players active in the 2019 2020 season Aaron Gordon Player Aaron Holiday Adam Mokoka Abdel Nader Admiral Schofield WAS Z Variable symmetric Numerical Variable Team Height Inches ORL Data value a x x S IND LUSE SALT OKC Import the dataset into SALT for analyzing Data value b x x CHI After you have clicked the tab for your selected topic and read the problem answer the questions below a Use SALT to summarize the data and fill in the following table rounding values to four decimal places as needed Data value a is N 80 529 73 77 77 77 b Create a histogram with Starting Point and Bin Class Width values asked for The distribution for this variable is mound shaped and is Mean 78 393 Our sample s minimum value is not Standard Deviation 3 4505 c Determine the relative standing for the two data values of interest using the z score formula appropriate for samples Round your answers to two decimal places standard deviations below Median 78 Find the data value with a z score of 3 rounded to two decimal places x 2 5 X Minimum Value standard deviations above to determine the number of standard deviations each data value is away from the mean Find the data value with a z score of 3 rounded to two decimal places X Z S X 69 the mean whereas data value b is the mean Remember to take the absolute value of the z scort maximum is histogram in SALT it can be observed that almost all A Maximum Value 89 d Most data points are within three standard deviations of the mean In other words most observations will have a score that is larger than 3 and less than 3 at least roughly further than 3 standard deviations below the mean Our sample s further than 3 standard deviations above the mean Upon further inspection of the observations would have a z score between 3 and