Determine whether the statement makes sense or does not make
Last updated: 10/30/2023

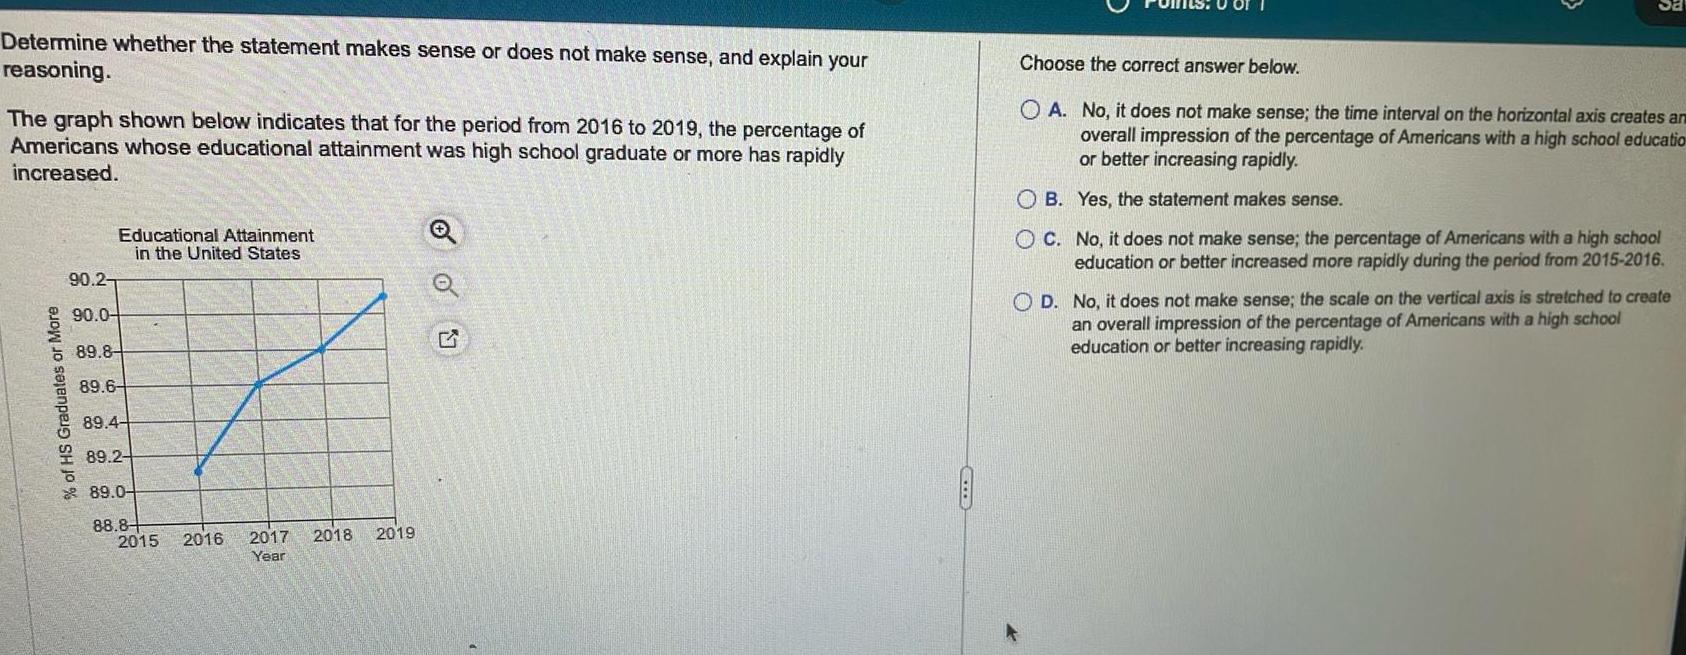
Determine whether the statement makes sense or does not make sense and explain your reasoning The graph shown below indicates that for the period from 2016 to 2019 the percentage of Americans whose educational attainment was high school graduate or more has rapidly increased of HS Graduates or More Educational Attainment in the United States 90 2 90 0 89 8 89 6 89 4 89 2 89 0 88 8 2015 2016 2017 Year 2018 2019 OU C of I Sa Choose the correct answer below OA No it does not make sense the time interval on the horizontal axis creates an overall impression of the percentage of Americans with a high school educatio or better increasing rapidly OB Yes the statement makes sense OC No it does not make sense the percentage of Americans with a high school education or better increased more rapidly during the period from 2015 2016 OD No it does not make sense the scale on the vertical axis is stretched to create an overall impression of the percentage of Americans with a high school education or better increasing rapidly