Probability Questions and Answers

Statistics
ProbabilityPoints 0 87 of 1 Three randomly selected children are surveyed The ages of the children are 1 3 and 8 Assume that samples of size n 2 are randomly selected with replacement from the population of 1 3 and 8 Listed below are the nine different samples Complete parts a through d 1 1 1 3 1 8 3 1 3 3 3 8 8 1 8 3 8 8 8 Type integers or simplified fractions c Find the mean of the sampling distribution of the sample median 4 Type an integer or a decimal Do not round d Based on the preceding results is the sample median an unbiased estimator of the population median Why or why not points O A The sample median does not target the population median As such the sample median does not make a good estimator of the population median OB The sample median targets the population median As such the sample median does not make a good estimator of the population median OC The sample median targets the population median As such the sample median makes a good estimator of the population median OD The sample median does not target the population median As such the sample median makes a good estimator of the population median Save

Statistics
ProbabilityThe accompanying table desc Complete parts a through d BEB Click the icon to view the a Find the probability of gettin Type an integer or a deci b Find the probability of gettin Type an integer or a deci Which probability is relevan Number of Girls x 0 1 2 2 5 3 4 RM 5 2 6 7 8 P x 0 003 0 034 0 107 0 194 0 199 0 324 0 194 0 107 0 034 0 003 The random variable x represents the number of girls among 8 children 8 births the result from part a or part b

Statistics
ProbabilityBased on a survey assume that 48 of consumers are comfortable having drones deliver their purchases Suppose we want to find the probability that when four consumers are randomly selected exactly two of them are comfortable with the drones What is wrong with using the multiplication rule to find the probability of getting two consumers comfortable with drones followed by two consumers not comfortable as in this calculation 0 48 0 48 0 52 0 52 0 0623 Choose the correct answer below OA The probability of the second consumer being comfortable with drones cannot be treated as being independent of the probability of the first consumer being comfortable with drones OB There are other arrangements consisting of two consumers who are comfortable and two who are not The probabilities corresponding to those other arrangements should also be included in the result OC The event that a consumer is comfortable with drones is not mutually exclusive with the event that a consumer is not comfortable with drones OD The calculation assumes that the first two consumers are comfortable with drones and the last two are not but this arrangement is not possible

Statistics
ProbabilityV x 2 3y x 0 y 9 Sketch the region y 10 O 8 6 4 2 y 10 8 6 4 the solid obtained by rotating the region bounded by the giver curves about the specified me about the y axis 2 2 4 6 F 8 10 X X 10 8 6 y 4 2 y 10 8 6 4 2 2 4 i1 6 8 10 X X 91 F Mostly sunny

Statistics
Probabilitythe random variable X is normally distributed with mean 50 and standard dev Compute the probability Be sure to draw a normal curve with the area correspondi ability shaded P 57 x 68 AAA 50 57 68 50 57 68 x 68 Round to four decimal places as needed G 50 57 68

Statistics
ProbabilityThe mean incubation time of fertilized eggs is 19 days Suppose the incubation approximately normally distributed with a standard deviation of 1 day a Determine the 15th percentile for incubation times b Determine the incubation times that make up the middle 39 of fertilized en

Statistics
Probabilitydard normal curve in parts a through c below a Find the area under the normal curve to the left of z 3 plus the area under the now urve to the right of z 3 he combined area is Round to four decimal places as needed

Statistics
Probabilitystandard normal distribution 85 of the distribution from the area in the The z scores are Use a comma to separate answers as needed Round to two decimal places as neede

Statistics
Probabilityr the mean age of an inmate on death row was 39 9 years A sociologist wonder the mean age of a death row inmate has changed since then She randomly sel w inmates and finds that their mean age is 38 2 with a standard deviation of 8 9 ct a 95 confidence interval about the mean age What does the interval imply k the icon to view the table of critical t values egers or decimals Do not round Ea 95 confidence interval about the mean age confidence the mean age of a death row inmate is between two decimal places as needed years and ye

Statistics
Probabilitystandard deviation in the pressure required to open a certain valve is known to be a to changes in the manufacturing process the quality control manager feels that the pr ability has been reduced State the null and alternative hypotheses in words State the null and alternative hypotheses symbolically Explain what it would mean to make a Type I error Explain what it would mean to make a Type II error What would it mean to make a Type I error the hypothesis that the pressure variability is e manager when the true pressure variability is pe integers or decimals Do not round ld it mean to make a Tvne Il error psi
Statistics
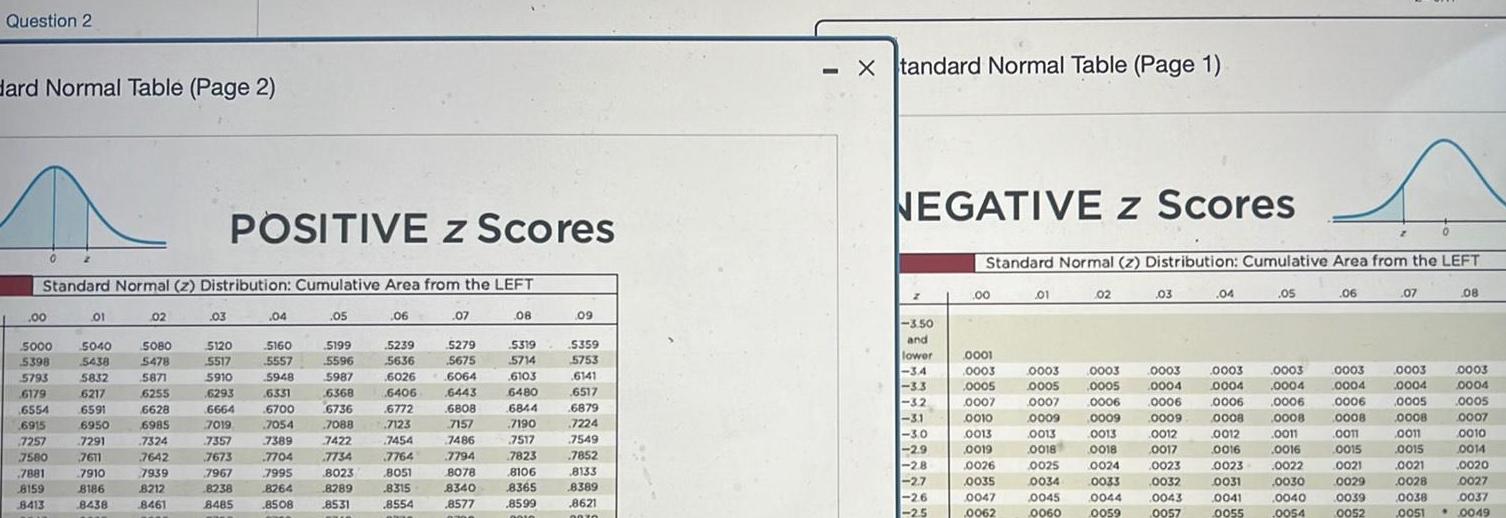
ProbabilityQuestion 2 Hard Normal Table Page 2 00 Standard Normal z Distribution Cumulative Area from the LEFT 5000 5398 5793 6179 GEKA 6554 2 6915 6915 01 5040 5438 5832 6217 6217 GEO 6591 6950 6950 7291 7257 7291 7580 7611 7881 7910 8159 8186 8413 8438 02 5080 5478 5871 6255 6529 6628 6985 7324 7642 7642 7939 8212 8461 POSITIVE z Scores 03 5120 5517 5910 6293 6293 6666 7019 7357 7673 7967 8238 8485 04 5160 5557 5948 6331 5700 6700 2054 7054 7389 7789 7704 7995 8264 8508 05 5199 5596 5987 6368 6776 6736 7088 7422 7422 7734 8023 8289 8531 06 5239 5636 6026 6406 6772 6772 7123 7454 7764 8051 8315 8554 ha 07 5279 5675 6064 6443 6808 7157 7157 7486 7794 8078 8340 8577 n 08 5319 5714 6103 6480 6844 6644 27190 7190 7517 7517 7823 7625 8106 8365 8599 0010 09 5359 5753 6141 6517 6879 6879 7224 crowd 7549 7852 1632 8133 8389 8621 2076 Xtandard Normal Table Page 1 NEGATIVE Z Scores 3 50 and lower 34 ZT 3 3 32 3 2 BETY 3 1 zo 30 2 9 2 8 2 7 2 6 2 5 Standard Normal z Distribution Cumulative Area from the LEFT 00 0001 0003 0005 0007 CO10 0010 001 0013 0019 0026 0035 0047 0062 01 0003 0005 0007 0009 0013 0018 0025 0034 0045 0060 02 0003 0005 0006 0009 0013 0018 0024 0033 0044 0059 03 0003 0004 0006 0009 0012 0017 0023 0032 0043 0057 04 05 0003 0003 0004 0004 0006 0006 0008 0008 0012 0011 0016 0016 0023 0022 0031 0030 0041 0040 0055 0054 06 0003 0004 0006 0008 0011 0015 0015 0021 0029 0039 0052 07 0003 0004 0005 0008 0011 0015 0021 0028 08 0003 0004 0005 0007 0010 0014 0020 0027 0038 0037 0051 0049
Statistics
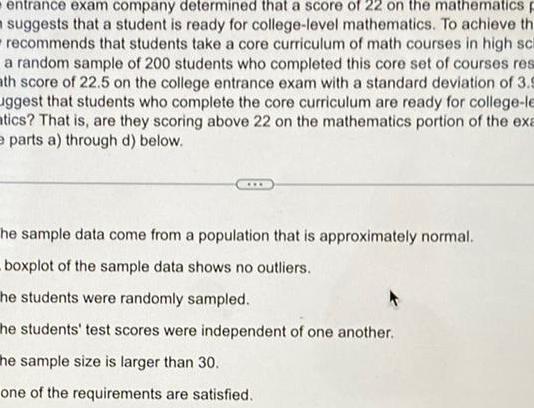
Probabilityentrance exam company determined that a score of 22 on the mathematics p suggests that a student is ready for college level mathematics To achieve th recommends that students take a core curriculum of math courses in high sch a random sample of 200 students who completed this core set of courses res ath score of 22 5 on the college entrance exam with a standard deviation of 3 9 uggest that students who complete the core curriculum are ready for college le tics That is are they scoring above 22 on the mathematics portion of the exa e parts a through d below he sample data come from a population that is approximately normal boxplot of the sample data shows no outliers he students were randomly sampled he students test scores were independent of one another he sample size is larger than 30 one of the requirements are satisfied

Statistics
ProbabilityOne research study of legal drug use among 12 to 17 year olds reported a decrease in use trom 11 4 in 1997 to 9 7 now Suppose a survey in a large high school reveals that in a randor sample of 1 041 students 93 report using illegal drugs Use a 0 05 significance level to test the principal s claim that illegal drug use in her school is below the current national average Formulate the null and alternative hypotheses Choose the correct answer below AH p 0 097 H p 0 097 CH p 0 097 H D0097 CS OB Hop 0 097 Hp 0 097 OD Ho p 0 097 H D 0 007
Statistics
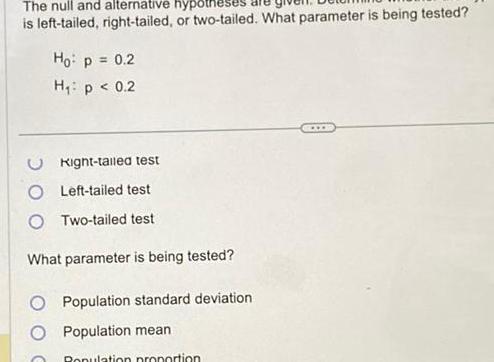
ProbabilityThe null and alternative hypot is left tailed right tailed or two tailed What parameter is being tested Ho p 0 2 H p 0 2 Right tailed test Left tailed test OTwo tailed test What parameter is being tested Population standard deviation Population mean Population proportion
Statistics
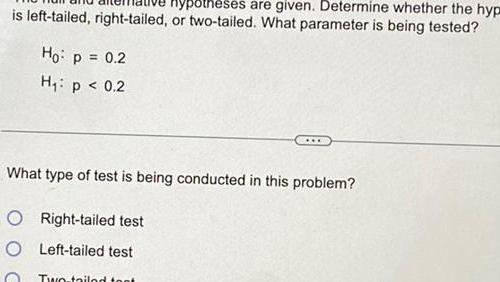
Probabilityis left tailed right tailed Ho p 0 2 H p 0 2 hypotheses are given Determine whether the hyp or two tailed What parameter is being tested What type of test is being conducted in this problem O Right tailed test O Left tailed test Two tailed toot

Statistics
ProbabilityK A simple random sample of size n 15 is drawn from a population that is normally distri sample mean is found to be x 20 9 and the sample standard deviation is found to be s Determine if the population mean is different from 26 at the a 0 01 level of significance
Statistics
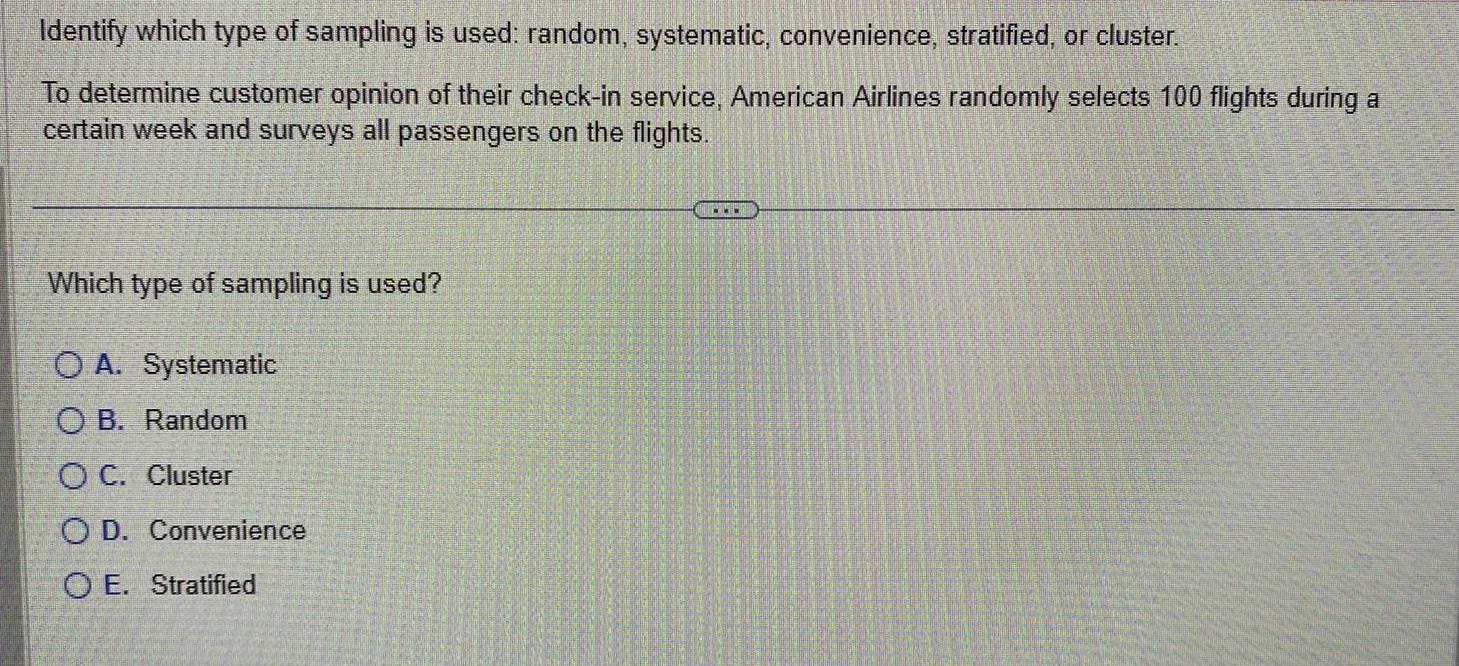
ProbabilityIdentify which type of sampling is used random systematic convenience stratified or cluster To determine customer opinion of their check in service American Airlines randomly selects 100 flights during a certain week and surveys all passengers on the flights Which type of sampling is used OA Systematic OB Random OC Cluster OD Convenience O E Stratified www

Statistics
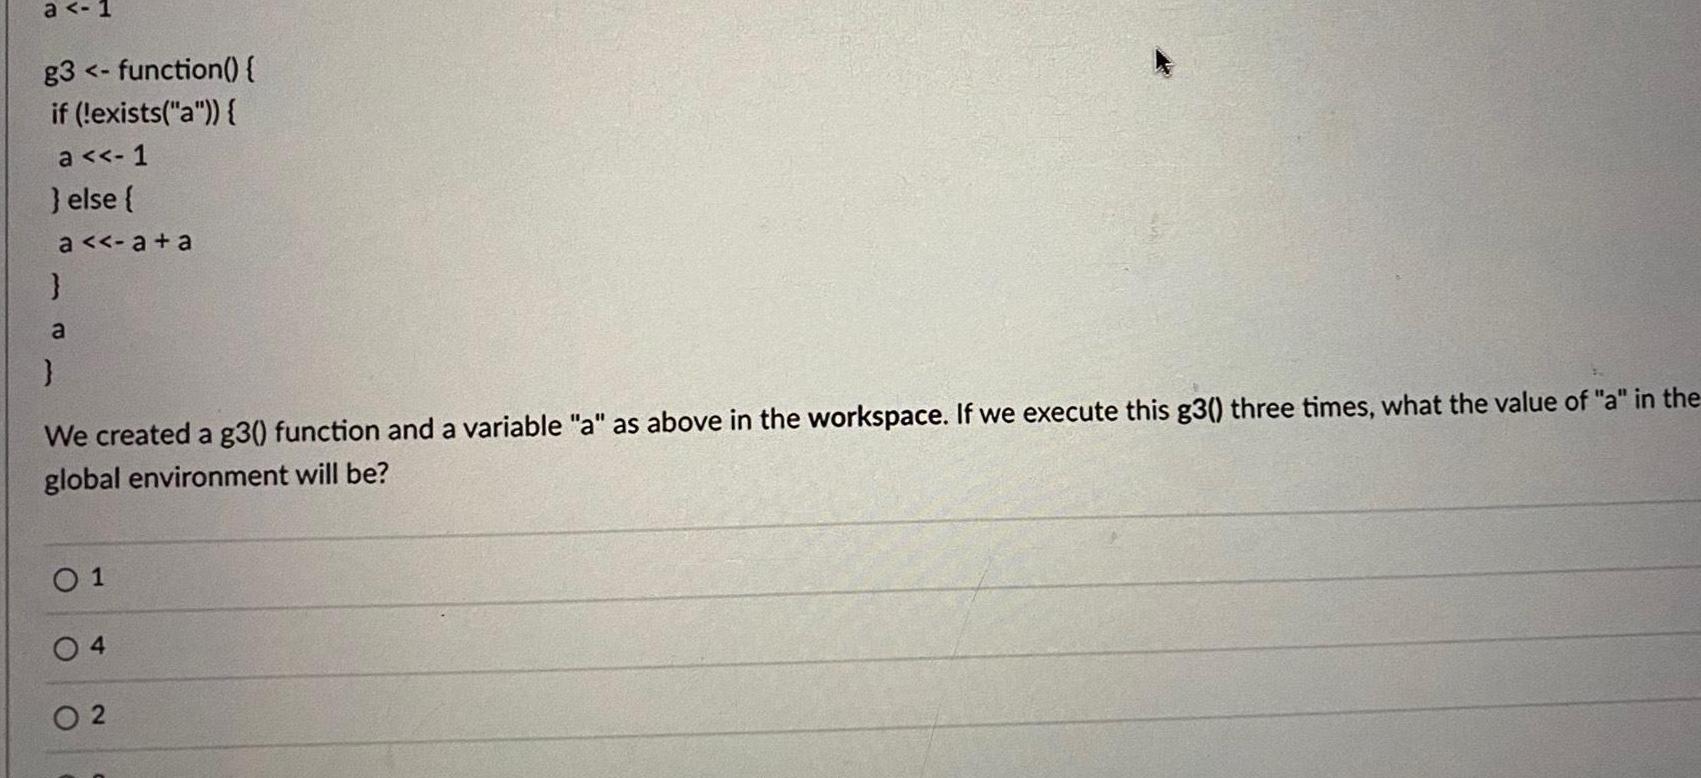
Probabilitya 1 g3 function if exists a a 1 else a a a a We created a g3 function and a variable a as above in the workspace If we execute this g3 three times what the value of a in the global environment will be 01 04 02

Statistics
ProbabilityGenerally an environment is similar to a named list But there are some exceptions Please choose the incorrect statement O Setting an object to NULL does not remove the object O The names in an environment are ordered O Every environment has a parent except for the empty environment O The single square bracket does not work for environments

Statistics
ProbabilityK The scores on a mathematics exam have a mean of 72 and a standard deviation of 7 Find the x value that corresponds to the 2 score 2 575 Round the answer to the nearest tenth OA 746 OC 790

Statistics
ProbabilityK Part 1 of 2 The population mean and standard deviation are given below Find the required probability and determine whether the given sample mean would be considered unusual For a sample of n 65 find the probability of a sample mean being greater than 220 if 219 and o 3 5 For a sample of n 65 the probability of a sample mean being greater than 220 if 219 and 3 5 is Round to four decimal places as needed FEED C Point

Statistics
ProbabilityNormal Probability Distribution Homew Question 13 O Points 0 of 1 Assume that the heights of women are normally distributed with a mean of 63 6 inches and a standard deviation of 2 5 inches If 75 women are randomly selected find the probability that they have a mean height between 63 and 65 inches A 0 2119 OB 0 0188 OC 0 3071 OD 0 9811 EXER

Statistics
ProbabilityK Determine whether the statement is true or false If it is false rewrite it as a true statement As the size of a sample increases the mean of the distribution of sample means increases Choose the correct answer below OA True OB False As the size of a sample increases the mean of the distribution of sample means decreases O C False As the size of a sample increases the mean of the distribution of sample means does not change

Statistics
ProbabilityNormal Probability Distribution Homew Points 0 of 1 Assume that the salaries of elementary school teachers in the United States are normally distributed with a mean of 32 000 and a standard deviation of 3000 If 100 teachers are randomly selected find the probability that their mean salary is greater than 32 5C A 0 9525 OB 0 0475 OC 0 1312 OD 0 3312

Statistics
ProbabilityNon sampling error is O error that occurs in the collection recording or tabulation of data O chance error OZ P O the difference between a sample survey result and the corresponding census resul

Statistics
ProbabilityChebyshev s Theorem can be applied to O any distribution O skewed distributions only O bell shaped normal distributions only O symmetric distributions only

Statistics
ProbabilityA distribution curve that is right skewed has O a longer tail on the right side O a longer tail on the left side O both tails of the same length O a shorter tail on the right side

Statistics
ProbabilityA fact or numerical measure that is calculated using sample data is called a O mean O empirical measure O parameter O statistic

Statistics
Probability3 The sign test is a nonparametric test used to compare two population medians True OFalse Continue Reset answer

Statistics
ProbabilityQuestion 2 of 10 2 A random sample of 50 individuals are classified into one of six categories If it is believed that the proportion of individuals that would be classified in category 5 is 0 20 what is the expected number of individuals to be classified out of 50 into category 5 Answer Continue Reset answer

Statistics
ProbabilityQuestion 4 of S 4 Given the observed table below calculate the expected frequency of individuals classified in category 3 of both variables when conducting a test of homogeneity Category 1 2 3 Do not round your answer Answer 1 2 17 21 24 26 15 3 24 28 21 24

Statistics
Probability9 6 pts Find the six trigonometric functions of 8 if the given point 8 15 is on the terminal side of 0 In other words the point is the end of the hypotenuse from the origin and is the reference angle

Statistics
Probability20 points Emma decides to play a game where she rolls two dice Below is a table displaying all of the possible combinations of rolling two dice Note that the two dice are independent of each other Also note 2 1 means the first roll was a 2 while the second roll was a 1 2 3 4 5 6 1 1 1 2 1 3 1 4 1 5 1 6 1 2 1 2 2 2 3 2 4 2 5 2 6 2 A 3 1 3 2 3 3 3 4 3 5 3 6 3 4 1 4 2 4 3 4 4 4 5 4 6 4 5 1 5 2 5 3 5 4 5 5 5 6 5 6 1 6 2 6 3 6 4 6 5 6 6 6 a 5 points What is the probability that they roll an odd number on either of the dice b 5 points What is the probability exactly both dice land on the same number c 5 points What is the probability that the sum of both dice is greater than 3 d 5 points What is the probability of getting a sum of 1

Statistics
Probability20 points Let C and D be independent events with P C 0 35 P D 0 55 a 6 points What is P Cn D b 4 points Are C and D two disjoint events Why or why not c 6 points What is P CUD d 4 points Suppose there is a third event E that is independent from both C and D The P E 15 Do C D and E make a valid probability distribution

Statistics
Probability2 A statistics student observed 80 random numbers generated from a computer of which eighteen were twos If it is believed that the expected proportion of twos generated is 0 20 what is the expected number of twos Answer Continue Reset answer

Statistics
Probability2 A survey was conducted to determine how people feel about the quality of sports programming available on television Respondents were asked to rate the overall quality from 0 no quality at all to 100 extremely good quality The stem and leaf display of the data is shown below Stems Leaves 689 7 3 4 5 01135567 6 0234456789 7 0001589 8 0135679 9 5899 What percentage of the responders rated overall quality as very good rating of 80 or more

Statistics
Probability4 A financial service has 500 clients enrolled and the upper management wants to know whether the service it provides to affluent clients differs from the service it provides to lower income clients Each client is asked to rate his or her contact person at this financial institution The classification of the service provided is A outstanding A average and A under 2 poor The income categories of the clients are B 50 000 B 50 000 to under 100 000 and B 100 000 2 or more The results are shown in the table below Answer the following items a Complete the table b P BB c P B A d Are A and B independent events YES NO 3 Why

Statistics
ProbabilityA single die is rolled one time Find the probability of rolling a number at most 4 or a prime number 4 6 02 6 3 6 05 6

Statistics
ProbabilityThe life expectancy at birth of a person born in year x is approximated by the function f x 14 5 12 3 In x where x 0 corresponds to the year 1910 If this function remains accurate when will life expectancy at birth be 72 9 years O In the year 2034 O In the year 2030 O In the year 2026 O In the year 2038

Statistics
ProbabilityIn a clinical trial of a drug intended to help people stop smoking 133 subjects were treated with the drug for 12 weeks and 15 subjects experienced abdominal pain If someone claims that more than 8 of the drug s users experience abdominal pain that claim is supported with a hypothesis test conducted with a 0 05 significance level Using 0 16 as an alternative value of p the power of the test is 0 96 Interpret this value of the power of the test The power of 0 96 shows that there is a chance of rejecting the experience abdominal pain is actually then there is a chanc Type integers or decimals Do not round null hypothesis of p when the true proportion is actually That is if the proportion of users who m that the proportion of users who experience abdominal pain is than 0 08

Statistics
ProbabilityThe weights of the chocolate in Hershey Kisses are normally distributed with a mean of 4 5338 g and a standard deviation of 0 1039 g a For the bell shaped graph of the normal distribution of weights of Hershey Kisses what is the area under the curve b What is the value of the median c What is the value of the mode d What is the value of the variance a For the bell shaped graph of the normal distribution of weights of Hershey Kisses what is the area under the curve Type an integer or a decimal Do not round

Statistics
ProbabilityIn a poll 51 of the people polled answered yes to the question Are you in favor of the death penalty for a person convicted of murder The margin of error in the poll was 2 and the estimate was made with 96 confidence At least how many people were surveyed Click here to view the standard normal distribution table page 1 Click here to view the standard normal distribution table page 2 The minimum number of surveyed people was Round up to the nearest integer

Statistics
ProbabilityFor 100 births P exactly 58 girls 0 0223 and P 58 or more girls 0 067 Is 58 girls in 100 births a significantly high number of girls Which probability is relevant to answering that question Consider a number of girls to be significantly high if the appropriate probability is 0 05 or less The relevant probability is so 58 girls in 100 births GEILE a significantly high number of girls because the relevant probability is 0 05

Statistics
ProbabilityWhat percent of a standard normal distribution N 0 a 1 is found in each region Be sure to draw a graph Round your answers to the nearest whole number a Z 1 31 b Z 1 49 d Z 2 3 c 0 39 Z 1 6 T 1

Statistics
ProbabilityIs the random variable given in the accompanying table discrete or continuous Explain The random variable given in the accompanying table is Number of Girls x P x 0 0 063 0 250 0 375 0 250 0 063 1 2 3 4 because C D

Statistics
ProbabilityThe test statistic of z 1 51 is obtained when testing the claim that p 0 473 This is a two tailed test Using a 0 01 significance level complete parts a and b Click here to view the standard normal distribution table for negative z scores Click here to view the standard normal distribution table for positive z scores a Find the critical value s Select the correct choice below and fill in the answer box es within your choice Round to two decimal places as needed A There is one critical value the critical value is B There are two critical values the lower critical value is 2 58 and the upper critical value is 2 58 b Should we reject Ho or should we fail to reject Ho A Ho should not be rejected since the test statistic is in the critical region B Ho should not be rejected since the test statistic is not in the critical region OC Ho should be rejected since the test statistic is not in the critical region D Ho should be rejected since the test statistic is in the critical region

Statistics
ProbabilityIn a particular country 21 7 of the country s population is infected with HIV For those who carry HIV a particular test is 99 1 accurate For those who do not carry HIV the test is 92 1 accurate If an individual from the country has tested positive what is the probability that he carries HIV 0 230

Statistics
ProbabilityThe television show Pretty Betty has been successful for many years That show recently had a share of 30 meaning that among the TV sets in use 30 were tuned to Pretty Betty Assume that an advertiser wants to verify that 30 share value by conducting its own survey and a pilot survey begins with 15 households that have TV sets in use at the time of a Pretty Betty broadcast Round solutions to four decimal places if necessary Find the probability that none of the households are tuned to Pretty Betty P none Find the probability that at least one household is tuned to Pretty Betty P at least one Find the probability that at most one household is tuned to Pretty Betty P at most one

Statistics
Probabilitycollect 600 Complete parts a through e 597 Type an integer or a decimal Do not round d Find the expected value for a 3 bet 2 4 Type an integer or a decimal Do not round e If you bet 3 on a certain casino game the expected value is 3 5c Which bet is better in the sense of producing a higher expected value a 3 bet on the state s lottery or a 3 bet on the casino game Explain OA Neither bet is better because both games have the same expected value OB The state s lottery is a better bet because it has a larger expected value OC The casino game is a better bet because it has a larger expected value OD It is impossible to compare the values because they have different units