Statistics Questions and Answers

Statistics
StatisticsThe company that sells frozen pizza to stores in four markets in the United States Denver Baltimore Dallas and Chicago wants to examine the prices that the stores charge for pizza slices The accompanying boxplots compare data from a sample of stores in each market Complete parts a and b below a Do prices appear to be the same in the four markets Explain OA No prices appear to be both lower on average and more variable in Denver than in the other three cities B No prices appear to be lower on average in Chicago than in the other three cities C No prices appear to be both higher on average and more variable in Baltimore than in the other three cities OD Yes prices appear to be the same in the four markets b Does the presence of any outliers affect your overall conclusions about prices in the four markets OA No the presence of outliers does not affect the overall conclusions OB Yes Dallas s outlier increases its range compared to the ranges of the other cities OC Yes Baltimore s outliers increases its range compared to the ranges of the cities without outliers D Yes Chicago s outliers bring its average price down below the average prices of the other cities Price 15 3 0 25 20 1 5 F HIH HI tooo Denver Baltimore Dallas Market HIH Chicago

Statistics
StatisticsIn an attempt to decrease drunk driving police set up vehicle checkpoints during the July 4 evening The police randomly select vehicles to be stopped for informational checks On a particular roadway assume that 20 of all drivers have a blood alcohol level above the legal limit For a random sample of 15 vehicles compute the probability that exactly 6 of the 15 drivers will excee the legal limit O 0 O 0 6 O 0 04 0 06

Statistics
StatisticsA patient visits her doctor with concerns about her blood pressure If the systolic blood pressure exceeds 150 the patient is considered to have high blood pressure and medication may be prescribed The problem is that there is a considerable variation in a patient s systolic blood pressure readings during a given day A patient s systolic readings during a given day have a normal distribution with a mean of 160 mm mercury and a standard deviation of 20 mm If five measurements are taken at various times during the day what is the probability that the average blood pressure reading will be less than 150 and hence fail to indicate that the patient has a high blood pressure problem 0 3085 O 0 1911 O 0 1314 O 0 5000

Statistics
StatisticsLet Z be a random variable with a standard normal distribution Find the value of Z denoted zo such that P Z Zo 0 975 O 0 50 O 0 975 O 1 96 O2 51

Statistics
StatisticsFind the area under the standard normal curve between these values z 0 and z 3 49 00 O 0 10 O 0 25 O 0 50

Statistics
StatisticsThe z score tells you O how many standard deviations the value y is above to the right of or below to the left of the mean O how many units the value y is above to the right of or below to the left of the mean O how many standard measure the value y is above to the right of or below to the left of the mean O how many standard variance the value y is above to the right of or below to the left of the mean H

Statistics
StatisticsThe accompanying dotplot shows the heights of some of the singers in a chorus collected so that the singers could be positioned on stage with shorter ones in front and taller ones in back Complete parts a and b Click the icon to view the dotplot CHILD a Describe the distribution Choose the correct answer below OA The distribution is unimodal There is a center at around 62 inches Its mode is near 60 inches The heights range from 60 to 76 inches with most heights between 68 and 70 inches OB The distribution is bimodal There is a center at around 65 66 inches and a smaller center around 70 inches Its modes are near 65 inches and 70 inches The heights range from 60 to 76 inches with most heights between 65 and 70 inches OC The distribution has no noticeable modes The heights range from 60 to 76 inches with most heights between 63 and 73 inches OD The distribution is multimodal with centers at around 62 66 and 70 inches Its modes are near 60 inches 65 inches and 70 inches The heights range from 60 to 76 inches with most heights between 65 and 66 inches b What is the most likely explanation for the features seen in the distribution OA The shape of the distribution is probably due to the fact that some of the singers wore heels and some did not OB The shape of the distribution is probably due to a mix of men and women in the group OC Height data do not usually take this shape but it does in this case because of how the singers are organized on stage OD Height data always take this shape because some people are tall and some are short Dotplot of height data 60 65 70 Height inches Q

Statistics
StatisticsA small warehouse employs a supervisor at 1400 a week an inventory manager at 750 a week six stock boys at 450 a week and four drivers at 490 a week a Find the mean and median wage The mean wage is The median wage is b How many employees earn more than the mean wage KILD 2 point s possible c Which measure of center best describes a typical wage at this company the mean or the median O A The median best describes the typical wage The mean is not a good measure of center because it is affected by the two higher salaries OB The median best describes the typical wage The mean is not a good measure of center because it is affected by the multitude of duplicate salaries OC The mean best describes the typical wage The median is not a good measure of center because it is affected by the two higher salaries OD The mean best describes the typical wage The median is not a good measure of center because it is affected by the multitude of duplicate salaries d Which measure of spread would best describe the payroll the range the IQR or the standard deviation Why OA The IQR is the better measure of spread The standard deviation and the range are both affected by the two higher salaries OB The standard deviation is the better measure of spread The IQR and the range are both affected by the two higher salaries OC The range is the better measure of spread Neither the IQR nor the standard deviation account for the extreme values OD The standard deviation is the better measure of spread Neither the IQR nor the range account for every data value

Statistics
StatisticsHere are boxplots of the points scored during the first 10 games of the season for both Scyrine and Alexandra a Summarize the similarities and differences in their performance so far b The coach can take only one player to the state championship Which one should she take Why a Choose the correct answer below O A Both girls have the same approximate mean but Alexandra has a larger IQR B Both girls have the same approximate median but Scyrine has a larger IQR OC Both players are about the same except Scyrine can score more points O D Both girls have the same approximate median and IQR but Scyrine has a larger range b Choose the correct answer below O A She should take Alexandra because she is a more consistent performer OB She should take Scyrine because she has the ability to score a higher point total OC It does not matter which player she takes because they both score the same average number of points A and B are both possible depending on the coach s preference Points 30 25 20 15 10 5 HIH 3 Scyrine Alexandra Player

Statistics
StatisticsIdentify the Ws name the variables specify for each variable whether its use indicates that it should be treated as categorical or quantitative and for any quantitative variable identify the units in which it was measured In performing research for an ecology class students at a college in upstate New York collect data on streams each year They record a number of biological chemical and physical variables including the stream name the substrate of the stream limestone shale or mixed the acidity of the water pH the temperature C and the BCI a numerical measure of biological diversity Identify the Who in this situation Choose the correct answer below A The streams OB The biological organisms that contribute to the BCI OC The students D The college OE The Who is not specified Identify the What in this situation Select all that apply A Substrate of the stream B Name of stream C Acidity of the water D BCI E Temperature ME The W

Statistics
StatisticsThe accompanying dotplot shows the carbohydrate content of 77 breakfast cereals in grams Complete parts a and b Click the icon to view the dotplot a Describe the distribution The distribution of cereal carbohydrates is with grams The data range from gram s to gram s with most c grams Type integers or decimals Do not round Use ascending order b Given what you know about breakfast cereals what additional variable do you think would help describe the shape you see on this graph OA Cereals have very specific government mandates requirements before they can be sold which probably explains the small spread B Very few cereal manufacturers take consumer health into account which probably explains the low number of dots below 10 grams C Cereals made for kids can be high in sugar and carbohydrates which probably explains the high number of dots at 21 grams D A lot of cereals are exactly the same which probably explains the number of tall columns of dots

Statistics
StatisticsIdentify the W s name the variables specify for each variable whether its use indicates that it should be treated as categorical or quantitative and for any quantitative variable identify the units in which it was measured In performing research for an ecology class students at a college in upstate New York collect data on streams each year They record a number of biological chemical and physical variables including the stream name the substrate of the stream limestone shale or mixed the acidity of the water pH the temperature C and the BCI a numerical measure of biological diversity Identify the Why in this situation Choose the correct answer below O A To mine for precious stones OB To reduce the acidity of New York s streams OC To increase biological diversity OD The Why is not specified Identify the How in this situation Select all that apply OA Mixing several different stream waters together and watching for a reaction OB Swimming in the streams OC Gathering sample water from each stream and studying it back at the campus CCID

Statistics
StatisticsShown to the right are the histogram and summary statistics for the number of camp sites at public parks in a particular state Use this information to complete parts a through d below a Which statistics would you use to identify the center and spread of this distribution Why Because the distribution is skewed the median b How many parks would you classify as outliers Explain 300 250 m A There are two outliers because two data values are more than 3 standard deviations from the mean B There are three outliers because three data values are more than 3 standard deviations from the mean C There are three outliers because three data values are either more than 1 5 IQRs below Q1 or more than 1 5 IQRS above Q3 D There are two outliers because two data values are either more than 1 5 IQRs below Q1 or more than 1 5 IQRS above Q3 E There are no parks that would be classified as outliers c Create a boxplot for these data Choose the correct boxplot below OA O B Q 300 250 m T Q should be used to describe the center and the quartiles and IQR should be used to describe the spread C 300 250 of Parks PAPP mm HO U 150 200 of Sites Park Q 100 O D 300 4 250 250 300 son HO a o Count 42 Mean 60 Median 44 StdDev 53 2 Min 0 Max 265 Q1 28 Q3 73

Statistics
StatisticsA medical researcher measures the increase in heart rate of patients who are taking a stress test What kind of variable is the researcher studying Choose the correct answer below O Quantitative variable Identifier variable Ordinal variable Categes Wahl

Statistics
StatisticsGiven are histograms and the five number summaries for the average windspeeds in a particular region for the year 2011 and the year 2016 Compare these distributions and be sure to address shape including outliers if there are any center and spread Click the icon to view the histograms and five number summaries The distribution for 2011 is unimodal and skewed to the right while the distribution for 2016 is unimodal and skewed right buffess so than for 2011 There are for both distributions The center of the distribution for 2011 as measured by the is of the distribution for 2011 as measured by the is the spread of the distribution for 2016 Histograms and Five number Summaries of Days 100 80 60 40 20 2011 Average Wind Speed Year 2016 T Min 0 58 Q Q Q1 1 42 skeape 100 80 60 40 20 0 Median Q3 2 075 2 91 2016 2 3 4 Average Wind Speed Max 6 17 67 Q Q Ythe center of the distribution for 2016 The spri X D Time Remaining 00 29 42

Statistics
StatisticsThe Centers for Disease Control lists causes of death in the United States during 2013 Each person is assigned only one cause of death Heart Cancer BOXER a Is it reasonable to conclude that heart or respiratory diseases were the cause of approximately 29 of U S deaths in 2013 A No because there is no possibility for overlap B Yes because there is no possibility for overlap C No because there is the possibility of overlap D Yes because there is the possibility of overlap b What percent of deaths were from causes not listed here Round to one decimal place as needed c Select the diagram that represents these data Circulatory or Stroke Respiratory Accidents Other Cause of Death Heart disease Cancer Circulatory diseases and stroke Respiratory diseases Accidents Heart Cancer Circulatory Respiratory diseases Accidents Percent 23 5 22 5 5 0 5 7 5 0

Statistics
StatisticsThe cost C x where is the number of miles driven of renting a car for a day is 28 plus 1 45 per mile What is the slope of the linear function and its units select the correct units What is the y intercept and its units units What is the linear function C x C x Question Help Message instructor Select an answer Select an answer C Select an answer dollars miles per dollar miles

Statistics
StatisticsThe brain volumes cm of 20 brains have a mean of 1084 2 cm and a standard deviation of 122 9 cm Use the given standard deviation and the range rule of thumb to identify the limits separating values that are significantly low or significantly high For such data would a brain volume of 1360 0 cm be significantly high Significantly low values are cm or lower Type an integer or a decimal Do not round 0
Statistics
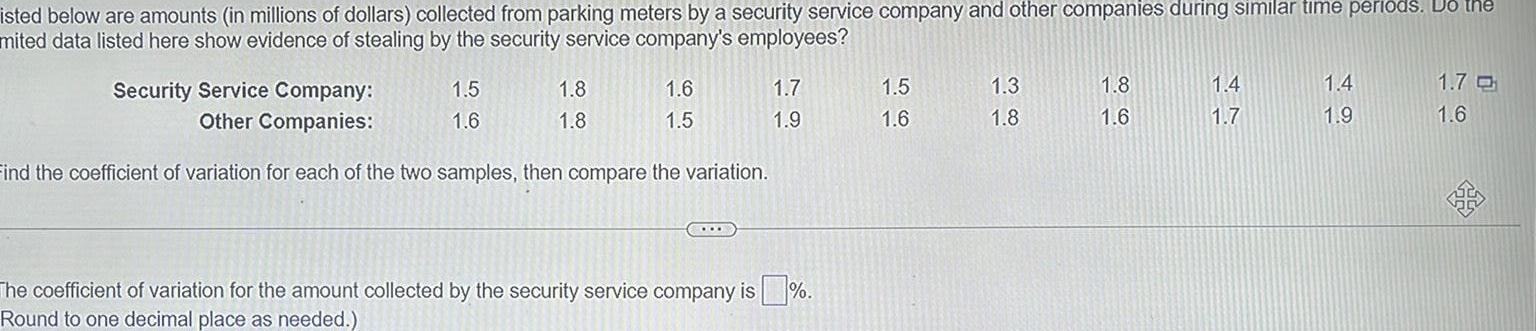
Statisticsisted below are amounts in millions of dollars collected from parking meters by a security service company and other companies during similar time periods Do the mited data listed here show evidence of stealing by the security service company s employees 1 5 1 6 Security Service Company Other Companies Find the coefficient of variation for each of the two samples then compare the variation 1 8 1 8 1 6 1 5 1 7 1 9 The coefficient of variation for the amount collected by the security service company is Round to one decimal place as needed 1 5 1 6 1 3 1 8 1 8 1 6 1 4 1 7 1 4 1 9 1 7 C 1 6

Statistics
Statisticsind the a mean b isted below are foot lengths in inches of randomly selected women in a study of a country s military in 1988 Are the statistics representative of the current population f all women in that country s military 9 7 8 7 10 5 8 7 9 4 9 1 Find the mean 10 4 8 8 9 6 10 5 10 5

Statistics
Statistics33 Observation versus experiment Researchers at the University of Pennsylvania found that patients who are divorced separated or widowed had approximately a 40 greater chance of dying or developing a new func tional disability in the first two years following cardiac surgery than their married peers The data included 1576 subjects who underwent cardiac surgery of which 65 were married 33 were divorced separated or widowed and 2 had never been married The find ings were reported to be statistically significant 25 a Without reading any further details of this study how do you know that this was an observational study b Suggest some variables that might differ between the subjects in the study who were married versus those who are divorced separated or widowed Are any of these possible confounding variables Explain c Summarize briefly the limitations of this study Despite these limitations explain why this study still furniches useful information in formulating a

Statistics
Statistics5 Getting teachers to come to school Elementary schools in rural India are usually small with a single teacher The teachers often fail to show up for work Here is an idea for improving attendance give the teacher a digital camera with a tamper proof time and date stamp and ask a student to take a photo of the teacher and class at the beginning and end of the day Offer the teacher better pay for good attendance verified by the photos Will this work A randomized comparative experiment started with 120 rural schools in Rajasthan and as signed 60 to this treatment and 60 to a control group Random checks for teacher attendance showed that 21 of teachers in the treatment group were absent as opposed to 42 in the control group 27 a Outline the design of this experiment b Label the schools and choose the first 10 schools for the treatment group If you use Table B start at

Statistics
Statistics43 Liquid water enhancers Bottled water flavored and plain is expected to become the largest segment of the liquid refreshment market by the end of this decade surpassing traditional carbonated soft drinks 34 Kraft s MiO a liquid water enhancer comes in a variety of fla vors and a few drops added to water gives a zero calorie flavored water drink You wonder if those who drink flavored water like the taste of MiO as well as they like the taste of a competing flavored water product that comes ready to drink a Describe a matched pairs experiment to answer this question Be sure to include proper blinding of your subjects What is your response variable going to be b You have 20 people on hand who prefer to drink flavored water Use the Simple Random Sample applet software or Table B at line 138 to do the

Statistics
Statistics47 Wine beer or spirits There is good evidence that mod erate alcohol use improves health Some people think that red wine is better for your health than other alco holic drinks You have recruited 300 adults aged 45 65 who are willing to follow your orders about alcohol con sumption over the next five years You want to compare the effects on heart disease of moderate drinking of just red wine just beer or just spirits Outline the design of a completely randomized experiment to do this No such experiment has been done because subjects aren t

Statistics
Statistics3 Quitting Smoking and Risk for Type 2 Diabetes Researchers studied a group of 10 892 middle aged adults over a period of nine years They found that smokers who quit had a higher risk of diabetes within three years of quitting than either nonsmokers or continuing smokers Does this show that stopping smoking causes the short term risk for Type 2 diabetes to increase Weight gain has been shown to be a major risk factor for developing Type 2 diabetes and is often a side effect of quitting smoking Smokers also often quit due to health reasons Based on this research should you tell a middle aged adult who smokes that stopping smoking can cause diabetes and advise him or her to continue smoking Carefully explain your answers to both questions

Statistics
Statistics15 Does Meditation Reduce Anxiety An experiment that claimed to show that meditation reduces anxiety proceeded as follows The experimenter in terviewed the subjects and rated their level of anxiety Then the subjects were randomly assigned to two groups The experimenter taught one group how to meditate and they meditated daily for a month The other group was simply told to relax more At the end of the month the experimenter interviewed all the subjects again and rated their anxiety level The meditation group now had less anxiety Psychologists said that the results were suspect because the ratings were not blind Explain what this means and how lack of blindness could bias the reported results mized laola

Statistics
StatisticsKraft Foods successfully introduced DiGiorno Pizza into the marketplace in 1996 Kraft conducted extensive research about the product and the marketplace before introducing this product to the public Many questions had to be answered before Kraft began production For example why do people eat pizza When do they eat pizza SMI Alcott conducted a research study for Kraft in which they sent out 1000 surveys to pizza lovers The results indicated that people ate pizza during fun social occasions or at home when no one wanted to cook People used frozen pizza mostly for convenience but selected carry out pizza for a variety of other reasons including quality and avoidance of cooking The Loran Marketing Group conducted focus groups for Kraft with women aged 25 to 54 Their findings showed that consumers used frozen pizza for convenience but wanted carry out pizza taste Kraft researchers realized that if they were to launch a successful frozen pizza that could compete with carry out pizza they had to develop a frozen pizza that a had restaurant takeout quality b had the convenience of freezer storage To satisfy these seemingly divergent goals Kraft developed DiGiorno Pizza This impressed focus group members and in a series of blind taste tests conducted by Product Dynamics DiGiorno Pizza beat out all frozen pizzas and finished second overall behind one carry out brand DiGiorno Pizza has continued to grow in sales and market share over the years According to AIB International DiGiorno Pizza was by far the top frozen pizza brand in the U S in 2011 which sales of 677 million when compared to the next brand which had sales of 294 million Instructions Can you think of any descriptive statistics that might have been used by Kraft in their decision making process

Statistics
Statistics7 Reducing Unemployment Will cash bonuses speed the return to work of unemployed people A state department of labor notes that last year 41 of people who filed claims for unemployment insurance found a new job within 15 weeks As an experiment the state offers 500 to people filing unemploy ment claims if they find a job within 15 weeks The percent who do so increases to 53 Suggest some conditions that might make it easier or harder to find a job this year as opposed to last year Confounding with these lurking variables makes it impossible to say whether the 500 bonus really caused the increase

Statistics
Statisticsd t 1 5t The function models d the distance in meters a car travels after t seco of constant acceleration from rest What is the distance in meters the c travels in 6 seconds

Statistics
StatisticsPoints 0 33 of 1 Fast food is often considered unhealthy because much of it is high in both fat and sodium But are the two related Here are the fat and sodium contents of several brands of burgers Analyze the association between fat content and sodium using correlation and scatterplots Fat g Sodium mg OA Sodium mg 1700 700 10 Fat g 19 29 35 924 1496 1317 Q 2 39 41 41 45 850 1172 930 1267 OB Sodium mg 1700 Part 3 of 3 700 1 10 Fat a D What is the correlation coefficient for the data 0 029 Round to three decimal places as needed Which of the following best describes the association between fat content and sodium OA There is a moderate positive linear association OB There is a strong positive linear association OC There is a moderate negative linear association OD There is a strong curved association OE There is a strong negative linear association OF There is no apparent association between fat content and sodium Sodium mg 1700 7001 10 Fat g Q Q OD Sodum mg 1700 700 10 Fat g Q


Statistics
StatisticsK ev The diameters of ball bearings are distributed normally The mean diameter is 134 millimeters and the standard deviation is 3 millimeters Find the probability that the diameter of a selected bearing is greater than 131 millimeters Round your answer to four decimal places Answer 2 Points Keypad Keyboard Shortcuts If you would like to look up the value in a table select the table you want to view then either click the cell at the intersection of the row and column or use the arrow keys to find the appropriate cell in the table and select it using the Space key Normal Table 00 to z Normal Table to z Ne

Statistics
StatisticsFind the area under the standard normal curve to the left of z 2 11 Round your answer to four decimal places if necessary Answer 2 Points K Keyboard S If you would like to look up the value in a table select the table you want to view then either click the cell at the intersection of the row and colu use the arrow keys to find the appropriate cell in the table and select it using the Space key Normal Table to z

Statistics
StatisticsConsider the accompanying data and scatterplot of the data from a small bookstore Find the correlation coefficient for the given data An earlier analysis found that the data had a moderately strong positive linear association Describe how this value confirms this relationship Think carefully about all the things you know from thi alue Click the icon to view the bookstore data and scatterplot pr 0 Round to three decimal pl Sales People and Sales Number of Sales People Working 4 6 9 10 10 13 15 17 21 x 10 6 SD x 6 10 Sales in 1000 9 10 14 14 22222 18 21 20 23 26 x 17 7 SD x 5 72 Q Q 3 D X

Statistics
StatisticsFast food is often considered unhealthy because much of it is high in both fat and sodium But are the two related Here are the fat and sodium contents of several brands of burgers Analyze the association between fat content and sodium using correlation and scatterplots 19 Fat g Sodium mg 924 Sodium mg Make a scatterplot for the data Choose the correct answer below OA O B 1700 700 10 29 35 1496 1317 Fat g 39 41 41 45 850 1172 930 1267 What is the correlation coefficient for the data 7 Round to three decimal places as needed Sodium mg 1700 700 10 Fat g Q Sodium mg 1700 700 10 Fat g Q OD Sodium mg 1700 700 10 Fat g Q

Statistics
StatisticsAn English professor assigns letter grades on a test according to the following scheme A Top 8 of scores B Scores below the top 8 and above the bottom 63 C Scores below the top 37 and above the bottom 15 D Scores below the top 85 and above the bottom 7 F Bottom 7 of scores Scores on the test are normally distributed with a mean of 77 and a standard deviation of 9 4 Find the minimum score required for an A gr Round your answer to the nearest whole number if necessary Answer 2 Points A Keyboard S If you would like to look up the value in a table select the table you want to view then either click the cell at the intersection of the row and c or use the arrow keys to find the appropriate cell in the table and select it using the Space key Note Selecting a cell will return the value asso with the column and row headers for that cell

Statistics
StatisticsCalculate the standard score of the given X value X 90 4 where Round the standard score to two decimal places Answer 2 Points 88 4 and 6 90 4 and indicate on the curve where z will be located The point can be moved by dragging or using the arrow keys Select the Reset button to reset the point 0 Z 0 1 Reset Keypad Keyboard Shortcu

Statistics
Statistics2 pts In a marathon is the finishing time more impressive if it is in the 10th percentile or in the 90th ercentile Explain why

Statistics
StatisticsUse the z score formula z Answer 2 Points x and the information below to find the value of o Round your answer to one decimal place if necessary O z 2 70 x 18 92 and 28 37 Keyp Keyboard Shor

Statistics
StatisticsUse the following table below to answer the questions on this assignment The total number of points scored in the Superbowl for the years 2001 2022 is below 74 51 45 34 69 50 43 31 65 48 38 31 62 46 37 16 1 5 pts Using you calculator CODAP Excel or another piece of software find the 5 number summary the mean x and standard deviation s for the data above Min Q1 Med 61 56 52 51 23 hy seperate questions Max

Statistics
Statistics6 pts Looking at the two Box Plots below which has a larger Range Which one has a larger IQR Justify your response show your work 39 46 5 42 Prime Ministers 54 Presidents 51 55 59 5 50 63 60 Age when elected 74 78 Range prime ministers range 74 39 35 IQR prime ministers IQR 63 46 5 16 5 I presidents range 78 42 36 I I presidents IQR 59 5 51 8 5 I I Presidents hold the larger range I I Prime Ministers hold the large IQR Using your answers above write a sentence or two about the distribution specifically the differences between the spread of the data between the two sets

Statistics
Statistics4 4 pts Looking at the image graph below which was used in an actual presentation by a member of the US house of representatives in 2015 write a brief analysis about how the chart is misleading Your analysis should include at least 2 3 complete sentences for full points PLANNED PARENTHOOD FEDERATION OF AMERICA ABORTIONS UP LIFE SAVING PROCEDURES DOWN 2 007 371 IN 2006 289 750 IN 2006 CANCER SCREENING PREVENTION SERVICES ABORTIONS 327 000 IN 2013 935 573 IN 2013

Statistics
Statistics6 pts The average age of a US president when elected is 55 50 years with a standard deviation of 7 27 years The average age of a Canadian Prime Minister when elected is 55 04 years with a standard deviation of 9 69 years When Obama was elected he was 47 46 years old and when Justin Trudeau was elected he was 43 85 years old Which age is more unusual for their respective position Be sure you justify your response mathematically

Statistics
StatisticsOn a recent quiz the class mean was 72 with a standard deviation of 3 Calculate the z score to 2 decima places for a person who received score of 81 Z score Is this unusual Further than 2 standard deviations away from the mean Unusual

Statistics
StatisticsThe quantitative data was gathered by taking a random sample Calculate the standard deviation Round to one decimal place X 24 23 26

Statistics
StatisticsHere is a sample data set n 48 that is nearly normal 55 56 4 61 3 62 6 62 6 63 8 66 66 7 67 7 68 68 6 70 1 70 3 70 3 70 8 71 3 71 7 71 9 71 9 72 1 72 6 74 74 2 75 6 76 2 76 2 76 8 77 79 2 79 7 80 4 82 82 3 84 4 84 4 86 8 87 7 88 2 88 2 90 91 4 93 1 380 66 4 70 6 73 77 85 3 93 6 How many outliers are in this data set if we define an outlier to be any piece of data more than 2 star deviations away from the mean Note This means you will need to find the mean and standard deviat this data

Statistics
StatisticsThe following are the amounts of total fat in grams from a sample of different kinds of sweet treats available at the local donut shop 15 21 18 17 19 21 22 15 23 15 22 20 22 22 20 23 16 25 18 21 a What is the range for this data set grams 22 b What is the standard deviation for this data set Round your answer to the nearest tenth if necessary

Statistics
StatisticsIn a neighborhood donut shop one type of donut has 540 calories four types of donuts have 530 calories two types of donuts have 410 calories two types of donuts have 560 calories and three types of donuts have 460 calories Find the range 0 Find the sample standard deviation Round your answer to the nearest tenth if necessary calories

Statistics
StatisticsUsing technology find the range and standard deviation Round to two decimals places The table below gives the number of hours spent watching TV last week by a sample of 24 childre 37 68 46 87 32 69 45 73 30 85 56 24 Range 89 79 64 68 67 26 41 32 41 48 96 19

Statistics
StatisticsCalculate the standard deviation of the sample quantitative data shown to two decimal places 9 1 21 3 21 2 12 6 21 1 27