Calculus Questions
The best high school and college tutors are just a click away, 24×7! Pick a subject, ask a question, and get a detailed, handwritten solution personalized for you in minutes. We cover Math, Physics, Chemistry & Biology.
Calculus
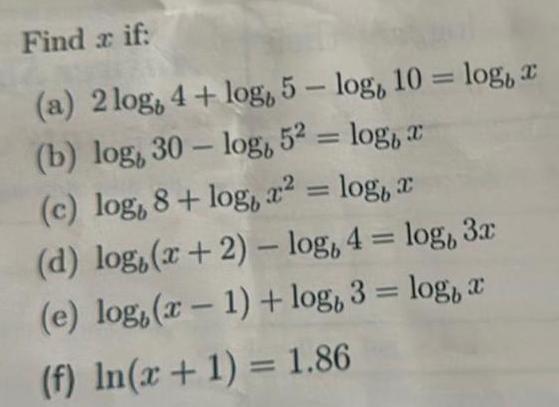
Vector CalculusFind a if a 2log 4 log 5 log 10 log a b log 30 log 52 log c c log 8 log x log x d log x 2 log 4 log 3x e log x 1 log 3 log a f In x 1 1 86


Calculus
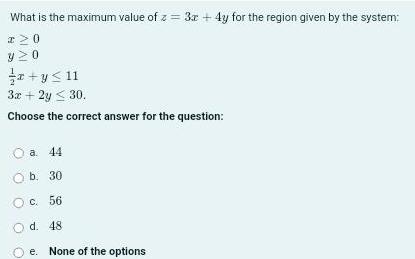
Vector CalculusWhat is the maximum value of z 3x 4y for the region given by the system I 0 y20 x y 11 3x 2y 30 Choose the correct answer for the question O a 44 O b 30 O c 56 d 48 e None of the options
Calculus
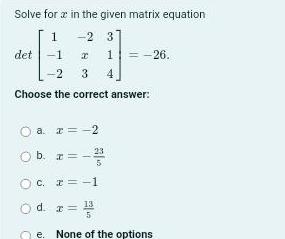
Application of derivativesSolve for a in the given matrix equation 1 2 3 det 1 x 1 26 2 3 4 Choose the correct answer a x 2 Ob z O c C x 1 Od 2 13 e None of the options
Calculus
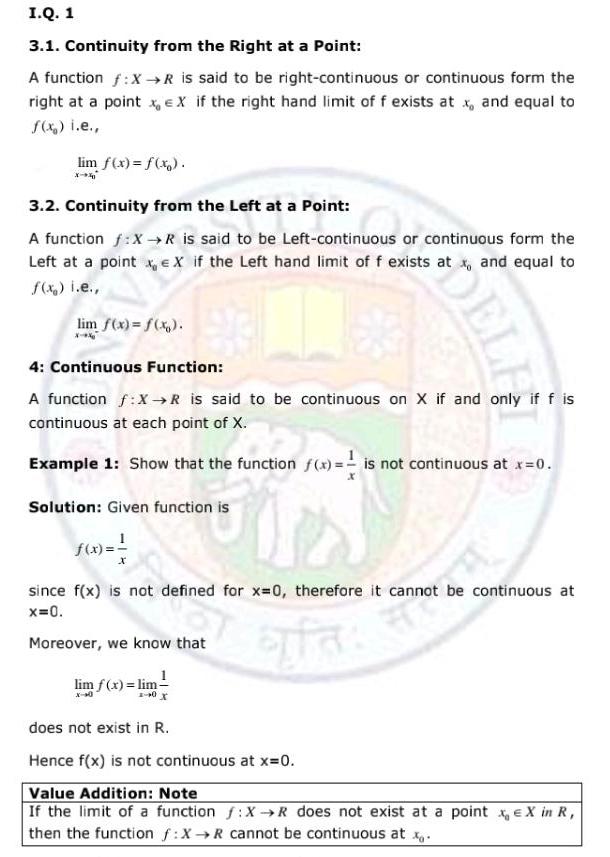
Indefinite IntegrationI Q 1 3 1 Continuity from the Right at a Point A function f X R is said to be right continuous or continuous form the right at a point x EX if the right hand limit of f exists at x and equal to f x i e lim f x f x X 3 2 Continuity from the Left at a Point A function f X R is said to be Left continuous or continuous form the Left at a point x X if the Left hand limit of f exists at x and equal to f x i e lim f x f x X 4 Continuous Function A function f X R is said to be continuous on X if and only if f is continuous at each point of X Example 1 Show that the function f x is not continuous at x 0 Solution Given function is f x since f x is not defined for x 0 therefore it cannot be continuous at x 0 Moreover we know that lim f x lim does not exist in R Hence f x is not continuous at x 0 Value Addition Note If the limit of a function f X R does not exist at a point x X in R then the function f X R cannot be continuous at x
Calculus
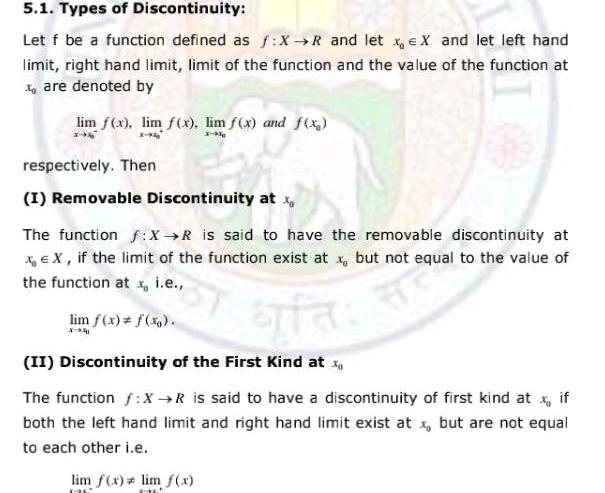
Differential equations5 1 Types of Discontinuity Let f be a function defined as f X R and let xeX and let left hand limit right hand limit limit of the function and the value of the function at xoare denoted by lim f x lim f x lim f x and f x respectively Then I Removable Discontinuity at x at have th The function f X R is said to have the removable discontinuity at x EX if the limit of the function exist at x but not equal to the value of the function at x i e lim f x f x X 40 ata II Discontinuity of the First Kind at x The function f X R is said to have a discontinuity of first kind at x if both the left hand limit and right hand limit exist at x but are not equal to each other i e 799 lim f x lim f x DL

Calculus
Application of derivatives1 Place the phases of the business cycle in order Recession Trough Peak Expansion How long do each business cycle last
Calculus
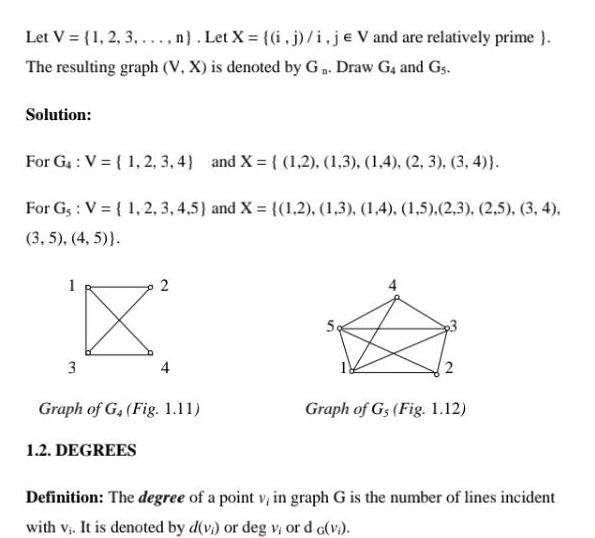
Definite IntegralsLet V 1 2 3 n Let X i j i je V and are relatively prime The resulting graph V X is denoted by G Draw G4 and G5 Solution For G V 1 2 3 4 and X 1 2 1 3 1 4 2 3 3 4 For G V 1 2 3 4 5 and X 1 2 1 3 1 4 1 5 2 3 2 5 3 4 3 5 4 5 3 2 4 Graph of G Fig 1 11 1 2 DEGREES Graph of Gs Fig 1 12 Definition The degree of a point v in graph G is the number of lines incident with v It is denoted by d v or deg v or d G vi
Calculus
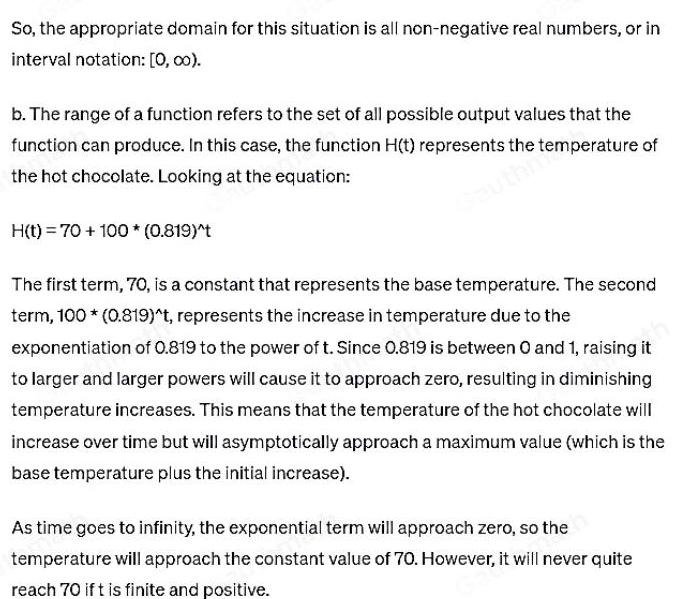
Definite IntegralsSo the appropriate domain for this situation is all non negative real numbers or in interval notation 0 00 b The range of a function refers to the set of all possible output values that the function can produce In this case the function H t represents the temperature of the hot chocolate Looking at the equation H t 70 100 0 819 t The first term 70 is a constant that represents the base temperature The second term 100 0 819 t represents the increase in temperature due to the exponentiation of 0 819 to the power of t Since 0 819 is between 0 and 1 raising it to larger and larger powers will cause it to approach zero resulting in diminishing temperature increases This means that the temperature of the hot chocolate will increase over time but will asymptotically approach a maximum value which is the base temperature plus the initial increase As time goes to infinity the exponential term will approach zero so the temperature will approach the constant value of 70 However it will never quite reach 70 ift is finite and positive

Calculus
Limits & ContinuityWhat are the extrema of f x 2x 2 4x 2 What are the domain and range of the function
Calculus
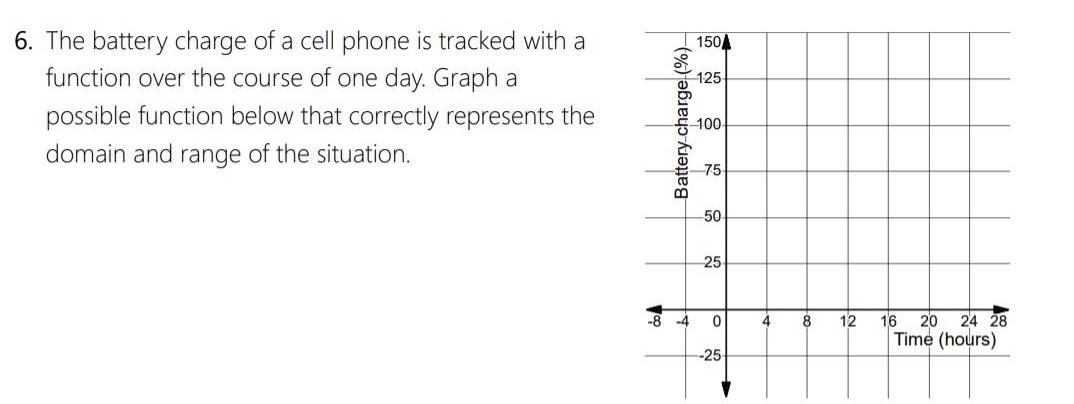
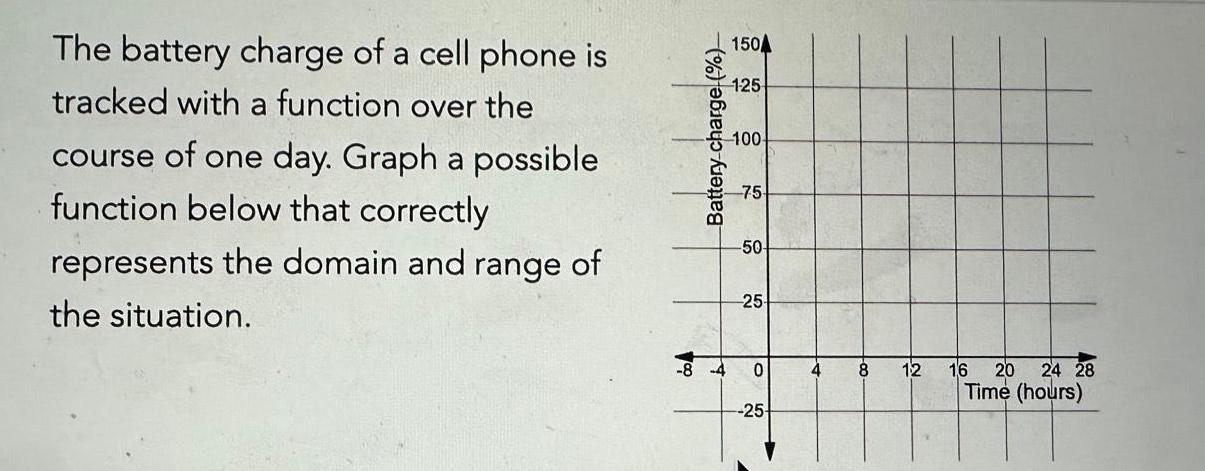
Application of derivatives6 The battery charge of a cell phone is tracked with a function over the course of one day Graph a possible function below that correctly represents the domain and range of the situation Battery charge 150 125 100 75 50 25 8 4 0 25 4 8 12 16 20 24 28 Time hours

Calculus
Limits & Continuity8 A wedding caterer charges a 200 service fee and 24 per plate cost of food for one guest Johanna has gotten RSVPs from 72 guests but is still waiting to hear back from the other 18 She als has to pay for her own food and the groom s food who are not considered guests Let C p represent Johanna s catering cost for p plates of food a What is the domain of C p b What is the range of C p
Calculus
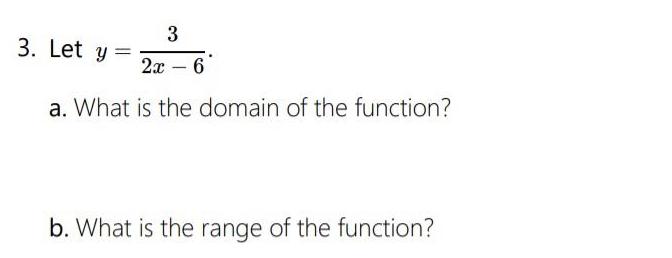
Differentiation3 2x 6 a What is the domain of the function 3 Let y b What is the range of the function
Calculus
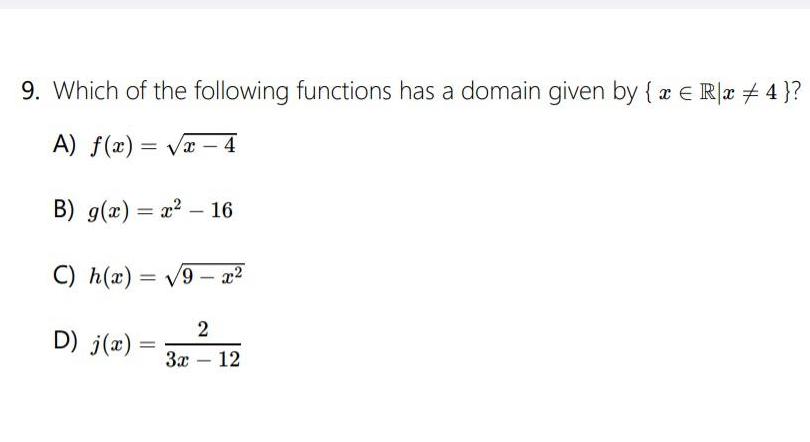
Application of derivatives9 Which of the following functions has a domain given by x Rx 4 A f x x 4 B g x x 16 C h x 9 x D j x 2 3x 12

Calculus
Limits & Continuity2 Sketch a graph that satisfies the given conditions lim f x 2 x 3 lim f x 4 x 3 lim f x 2 x 12 f 3 3 f 2 1
Calculus
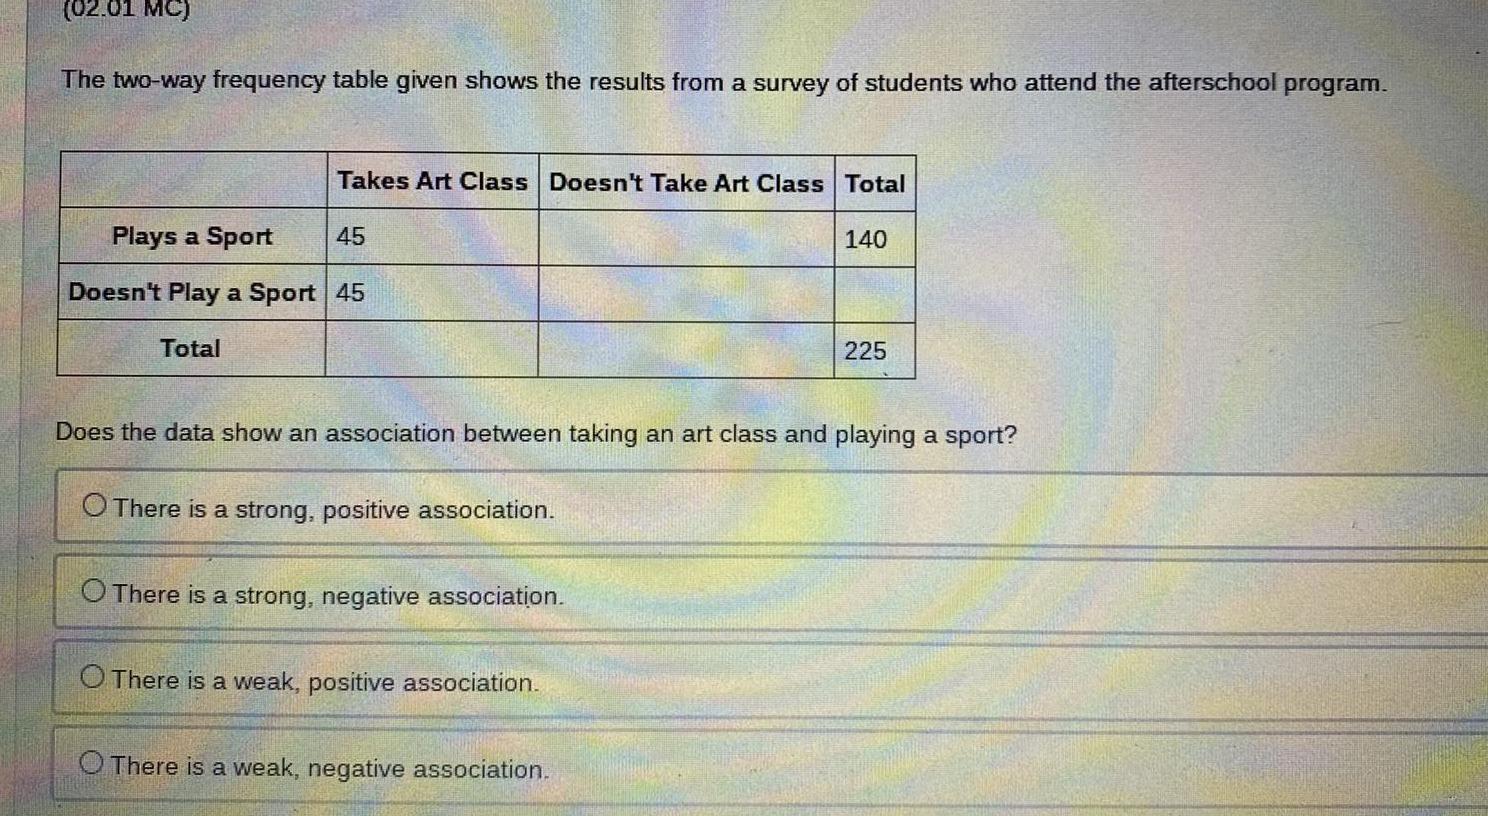
Application of derivatives02 01 MC The two way frequency table given shows the results from a survey of students who attend the afterschool program Takes Art Class Doesn t Take Art Class Total 140 Plays a Sport Doesn t Play a Sport 45 Total 45 Does the data show an association between taking an art class and playing a sport O There is a strong positive association O There is a strong negative association O There is a weak positive association 225 O There is a weak negative association
Calculus
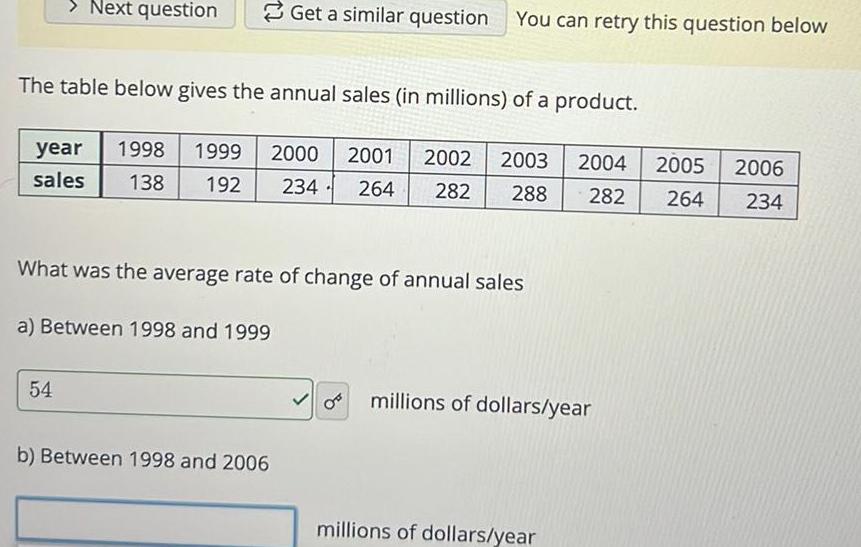
Application of derivativesNext question The table below gives the annual sales in millions of a product year 1998 1999 2000 2001 2002 2003 2004 sales 138 192 234 264 282 288 282 What was the average rate of change of annual sales a Between 1998 and 1999 54 Get a similar question You can retry this question below b Between 1998 and 2006 millions of dollars year millions of dollars year 2005 2006 264 234
Calculus
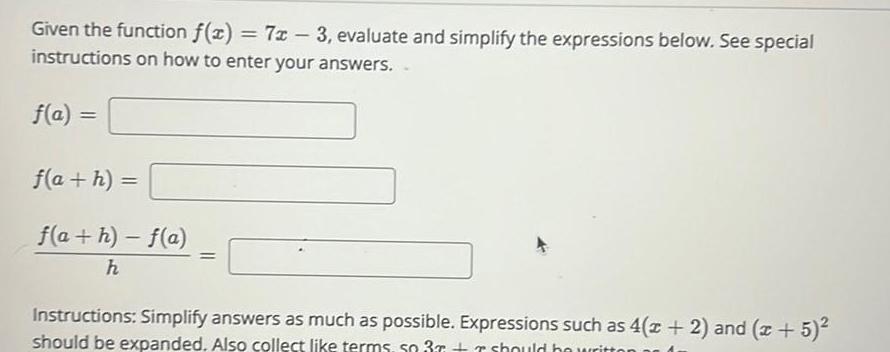
Vector CalculusGiven the function f x 7x 3 evaluate and simplify the expressions below See special instructions on how to enter your answers f a f a h f a h f a h Instructions Simplify answers as much as possible Expressions such as 4 x 2 and x 5 should be expanded Also collect like terms so 3r r should be writton
Calculus
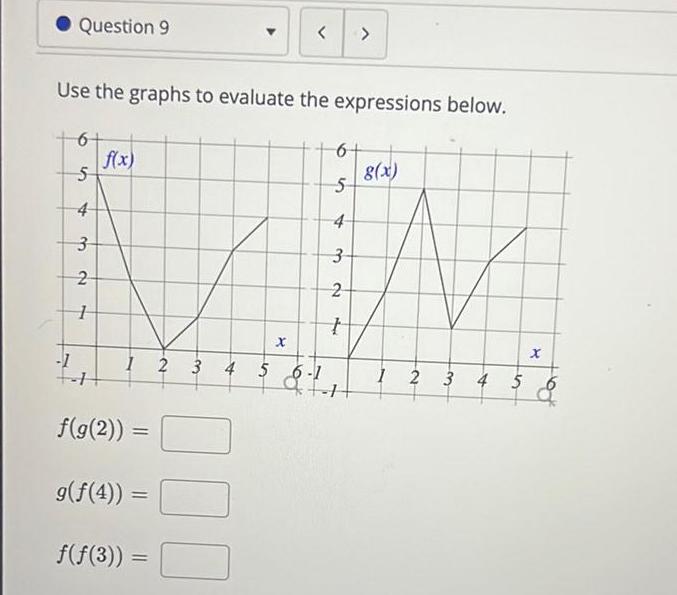
Vector CalculusQuestion 91 1 Use the graphs to evaluate the expressions below 6 5 4 3 2 1 f x f g 2 g f 4 f f 3 1 2 3 4 5 6 1 9 1 X 300 6 5 4 3 2 t g x 1 2 3 4 5 X
Calculus
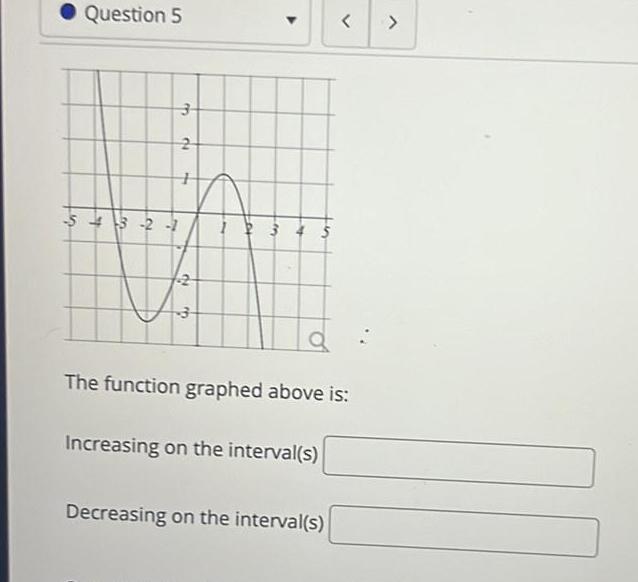
Application of derivativesir Question 5 3 2 1 3 2 My 2 3 2 3 4 S Increasing on the interval s a The function graphed above is Decreasing on the interval s

Calculus
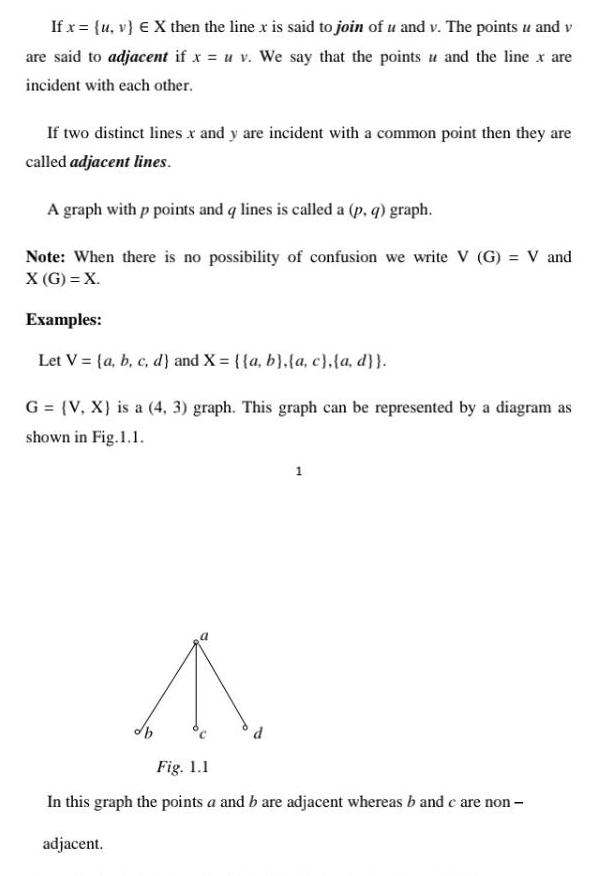
Limits & ContinuityIf x u v X then the line x is said to join of u and v The points u and v are said to adjacent if x u v We say that the points and the line x are incident with each other If two distinct lines x and y are incident with a common point then they are called adjacent lines A graph with p points and q lines is called a p q graph Note When there is no possibility of confusion we write V G V and X G X Examples Let V a b c d and X a b a c a d G V X is a 4 3 graph This graph can be represented by a diagram as shown in Fig 1 1 ob 1 Fig 1 1 In this graph the points a and b are adjacent whereas b and c are non adjacent
Calculus
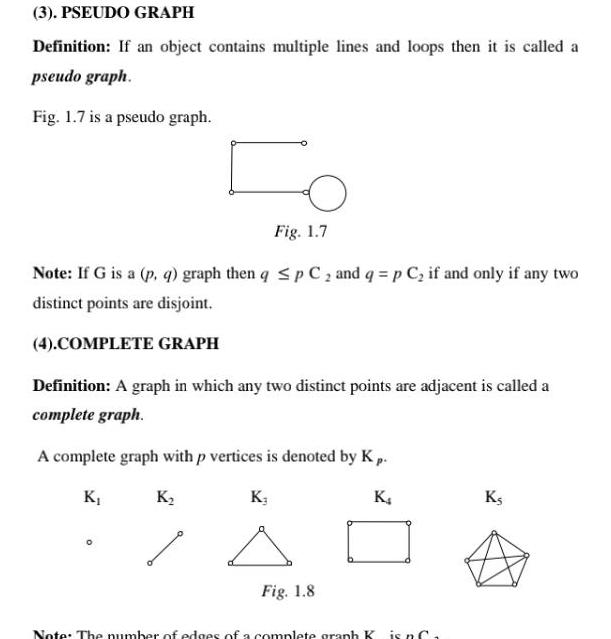
Differentiation3 PSEUDO GRAPH Definition If an object contains multiple lines and loops then it is called a pseudo graph Fig 1 7 is a pseudo graph Fig 1 7 Note If G is a p q graph then q p C and q p C if and only if any two distinct points are disjoint 4 COMPLETE GRAPH Definition A graph in which any two distinct points are adjacent is called a complete graph A complete graph with p vertices is denoted by K p K K 0 K K Fig 1 8 Note The number of edges of a complete granh K is n C Ks
Calculus
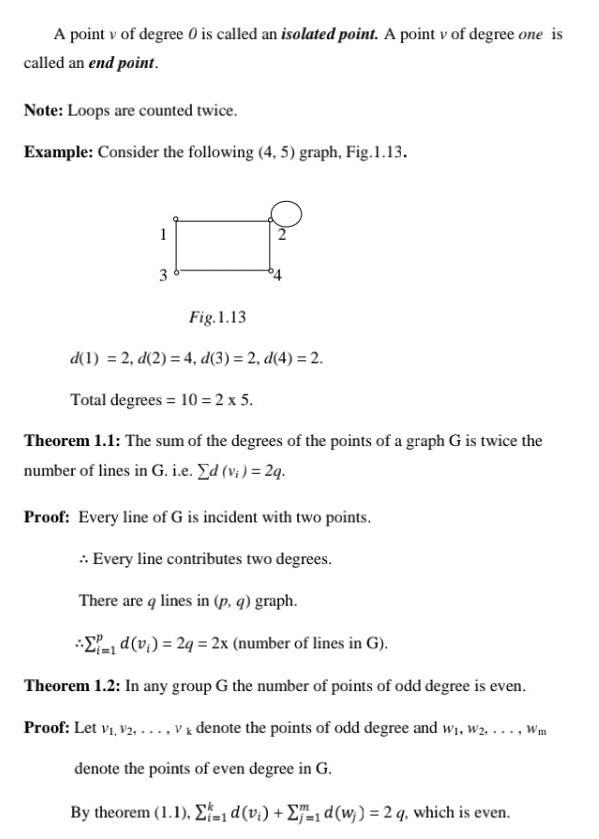
Limits & ContinuityA point v of degree 0 is called an isolated point A point v of degree one is called an end point Note Loops are counted twice Example Consider the following 4 5 graph Fig 1 13 1 3 Fig 1 13 d 1 2 d 2 4 d 3 2 d 4 2 Total degrees 10 2 x 5 Theorem 1 1 The sum of the degrees of the points of a graph G is twice the number of lines in G i e Ed vi 2q Proof Every line of G is incident with two points Every line contributes two degrees There are q lines in p q graph 1d v 2q 2x number of lines in G Theorem 1 2 In any group G the number of points of odd degree is even Proof Let V V2 V denote the points of odd degree and w W Wm denote the points of even degree in G By theorem 1 1 1 d v 1 d w 2 q which is even

Calculus
Limits & ContinuityA wedding caterer charges a 200 service fee and 24 per plate cost of food for one guest Johanna has gotten RSVPs from 72 guests but is still waiting to hear back from the other 18 She also has to pay for her own food and the groom s food who are not considered guests Let C p represent Johanna s catering cost for p plates of food a What is the domain of C p b What is the range of C p
Calculus
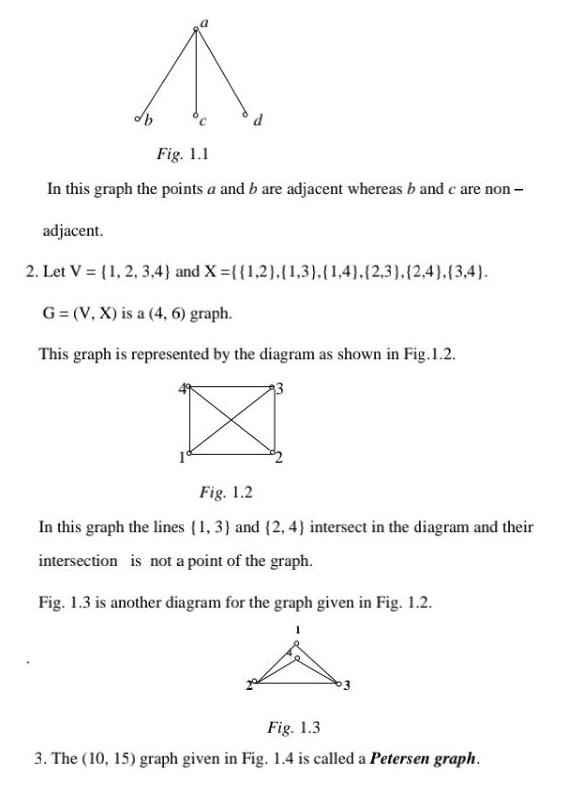
Application of derivativesA db Fig 1 1 In this graph the points a and b are adjacent whereas b and c are non adjacent 2 Let V 1 2 3 4 and X 1 2 1 3 1 4 2 3 2 4 3 4 G V X is a 4 6 graph This graph is represented by the diagram as shown in Fig 1 2 Fig 1 2 In this graph the lines 1 3 and 2 4 intersect in the diagram and their intersection is not a point of the graph Fig 1 3 is another diagram for the graph given in Fig 1 2 Fig 1 3 3 The 10 15 graph given in Fig 1 4 is called a Petersen graph
Calculus
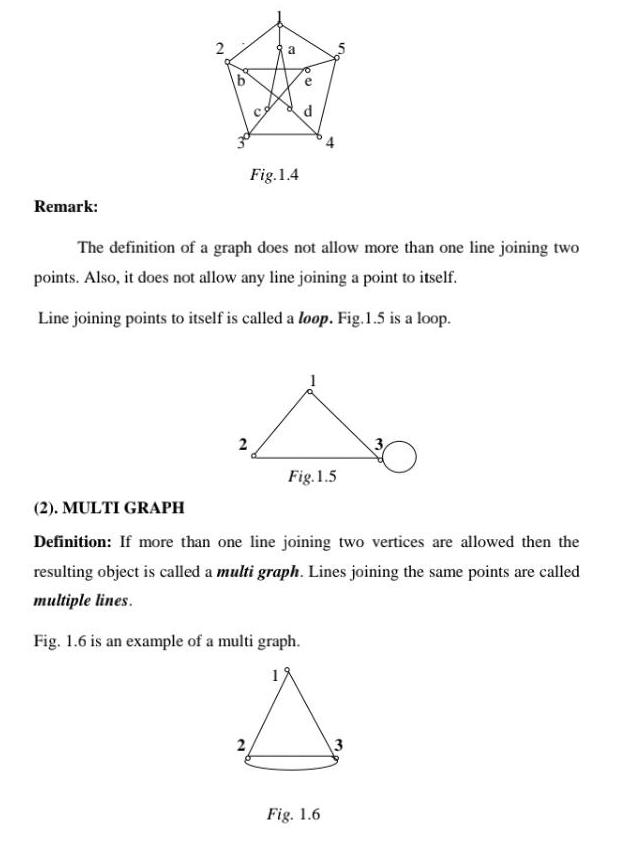
Indefinite IntegrationRemark 2 4 2 a Fig 1 4 2 20 d The definition of a graph does not allow more than one line joining two points Also it does not allow any line joining a point to itself Line joining points to itself is called a loop Fig 1 5 is a loop Fig 1 5 V 2 MULTI GRAPH Definition If more than one line joining two vertices are allowed then the resulting object is called a multi graph Lines joining the same points are called multiple lines Fig 1 6 is an example of a multi graph Fig 1 6

Calculus
Vector Calculusroblem 5 The value V in dollars of a truck owned by a company depreciates in value over time Its value t years after it is put in service is given by V t 36000 2400t a Find V 2 and interpret its meaning Be sure to include appropriate units b Find the inverse function t V c In words explain what the inverse function calculates d Use your answer to part c to evaluate t 10000 and interpret its meaning of t 10000 include units e Graph the functions V t and t V on separate axes and label all axes

Calculus
Vector CalculusThe temperature of a mug of hot chocolate in degrees Fahrenheit is given by H t 70 100 0 819 where t is the time in minutes after it is prepared a What is an appropriate domain for this situation Explain your reasoning b What is an appropriate range for this situation Explain your reasoning
Calculus
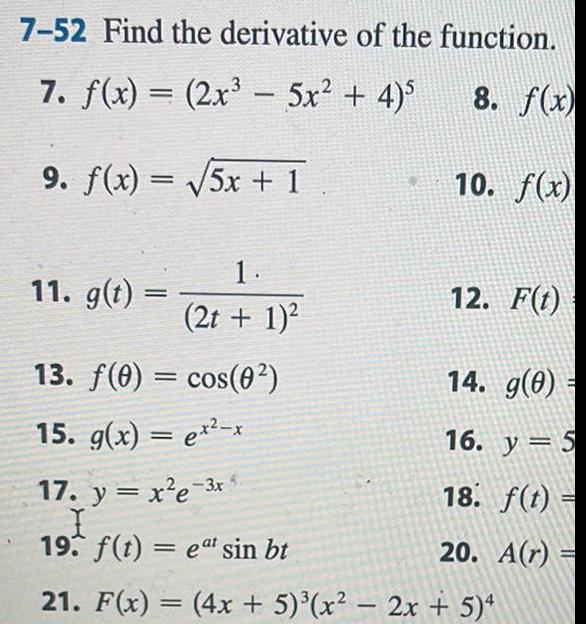
Differentiation7 52 Find the derivative of the function 7 f x 2x 5x 4 5 8 f x 9 f x 5x 1 10 f x 11 g t 1 2t 1 13 f 0 cos 0 15 g x ex x 12 F t 14 g 0 16 y 5 18 f t 20 A r 17 y x e 3x I 19 f t et sin bt 21 F x 4x 5 x 2x 5 4
Calculus
Indefinite IntegrationThe battery charge of a cell phone is tracked with a function over the course of one day Graph a possible function below that correctly represents the domain and range of the situation Co Battery charge 150 1 25 100 75 50 25 0 25 4 8 12 16 20 24 28 Time hours

Calculus
Application of derivativesWhich of the following functions has a domain given by x ER x 4 A f x x 4 B g x x 16 C h x 9 x 2 D j x 3x 12

Calculus
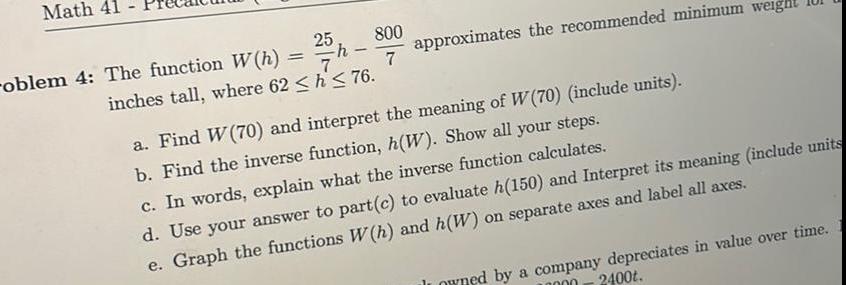
Limits & ContinuityMath 41 oblem 4 The function W h 25 h 800 7 7 inches tall where 62 h 76 approximates the recommended minimum weight a Find W 70 and interpret the meaning of W 70 include units b Find the inverse function h W Show all your steps c In words explain what the inverse function calculates d Use your answer to part c to evaluate h 150 and Interpret its meaning include units e Graph the functions W h and h W on separate axes and label all axes owned by a company depreciates in value over time 2400t 10000
Calculus
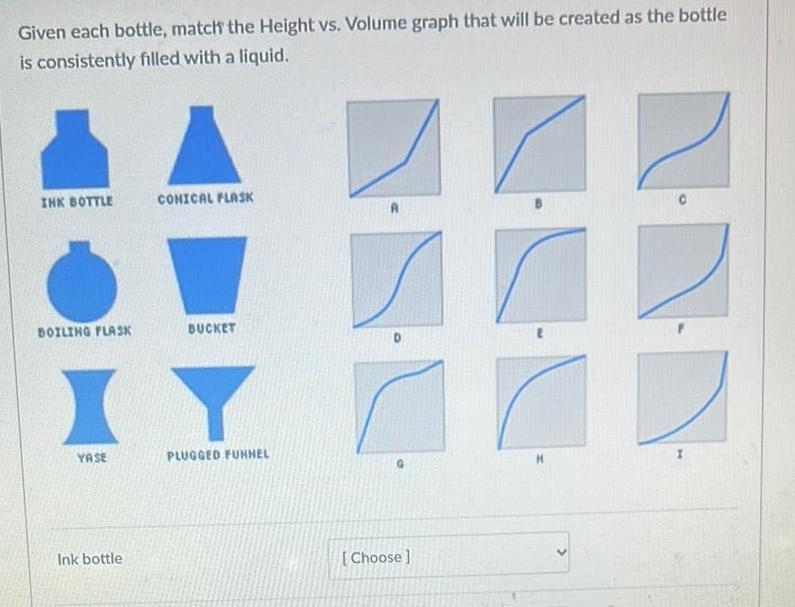
Definite IntegralsGiven each bottle match the Height vs Volume graph that will be created as the bottle is consistently filled with a liquid INK BOTTLE BOILING FLASK YASE Ink bottle CONICAL FLASK BUCKET PLUGGED FUNNEL Choose
Calculus
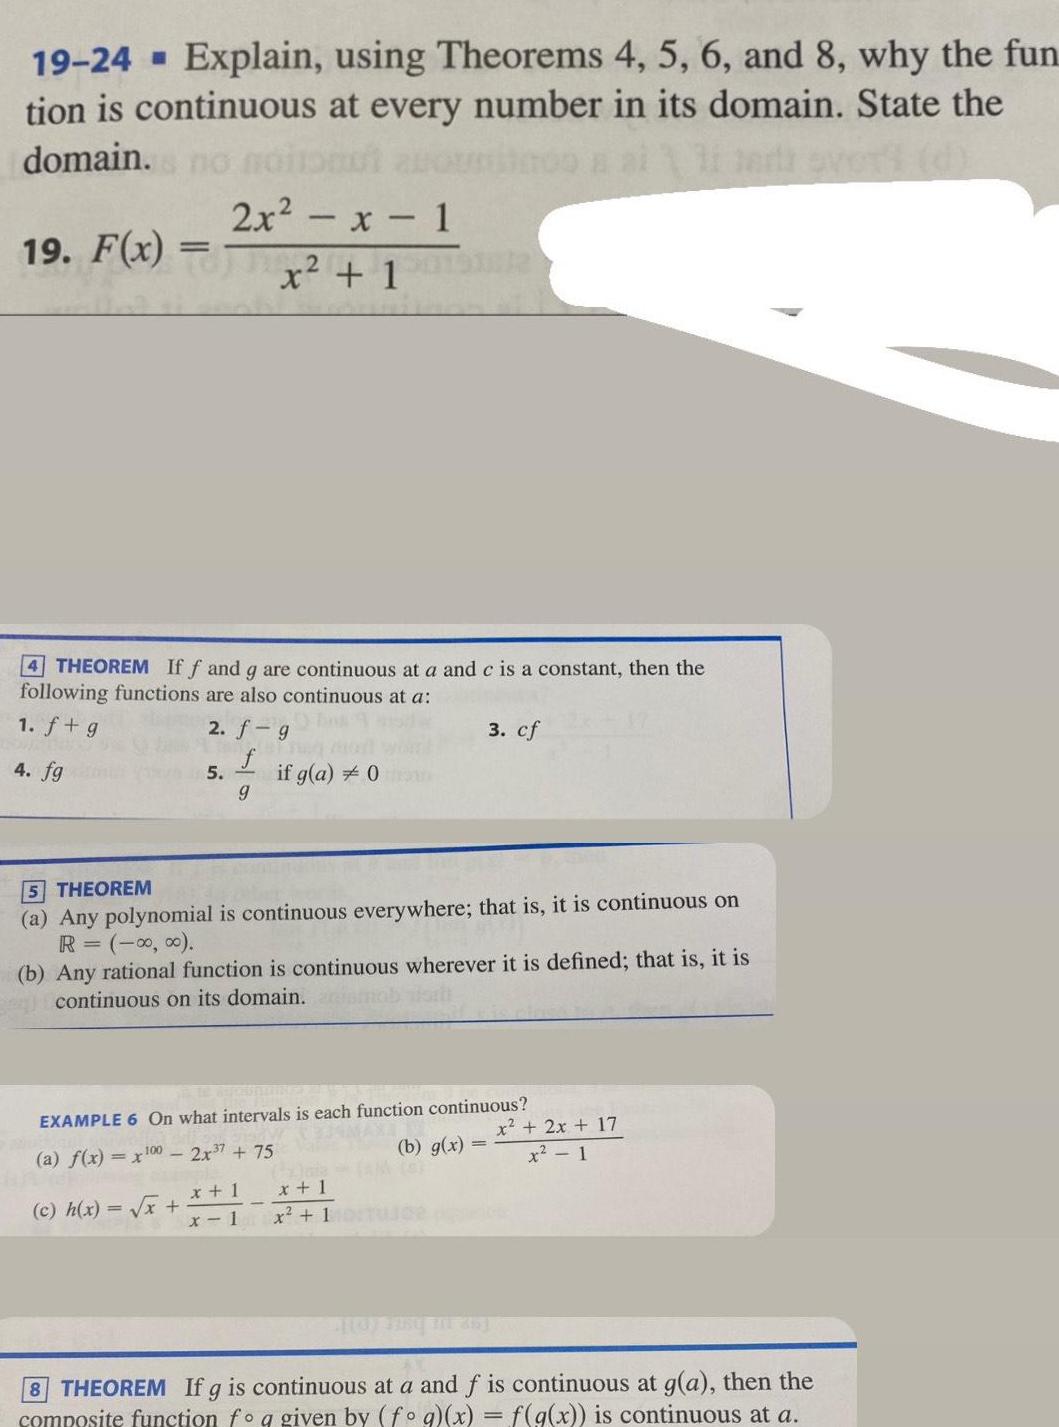
Application of derivatives19 24 Explain using Theorems 4 5 6 and 8 why the fun tion is continuous at every number in its domain State the domain no 19 F x 4 THEOREM If f and g are continuous at a and c is a constant then the following functions are also continuous at a 1 f g 2 f g f 4 fg g 2x x 1 x 1 5 c h x x if g a 0 5 THEOREM a Any polynomial is continuous everywhere that is it is continuous on R 0 0 b Any rational function is continuous wherever it is defined that is it is continuous on its domain EXAMPLE 6 On what intervals is each function continuous a f x x100 2x 7 75 x 1 x 1 3 cf b g x TAM OF x 1 x 1 User p x 2x 17 x 1 8 THEOREM If g is continuous at a and f is continuous at g a then the composite function fo q given by fog x f g x is continuous at a

Calculus
Vector CalculusProblem 1 Use the given functions to find f g x fg x f g x gof x fog and gog Simplify your answers 3 x 1 b f x x 4 a f x g x x 3x 1 g x 4x
Calculus
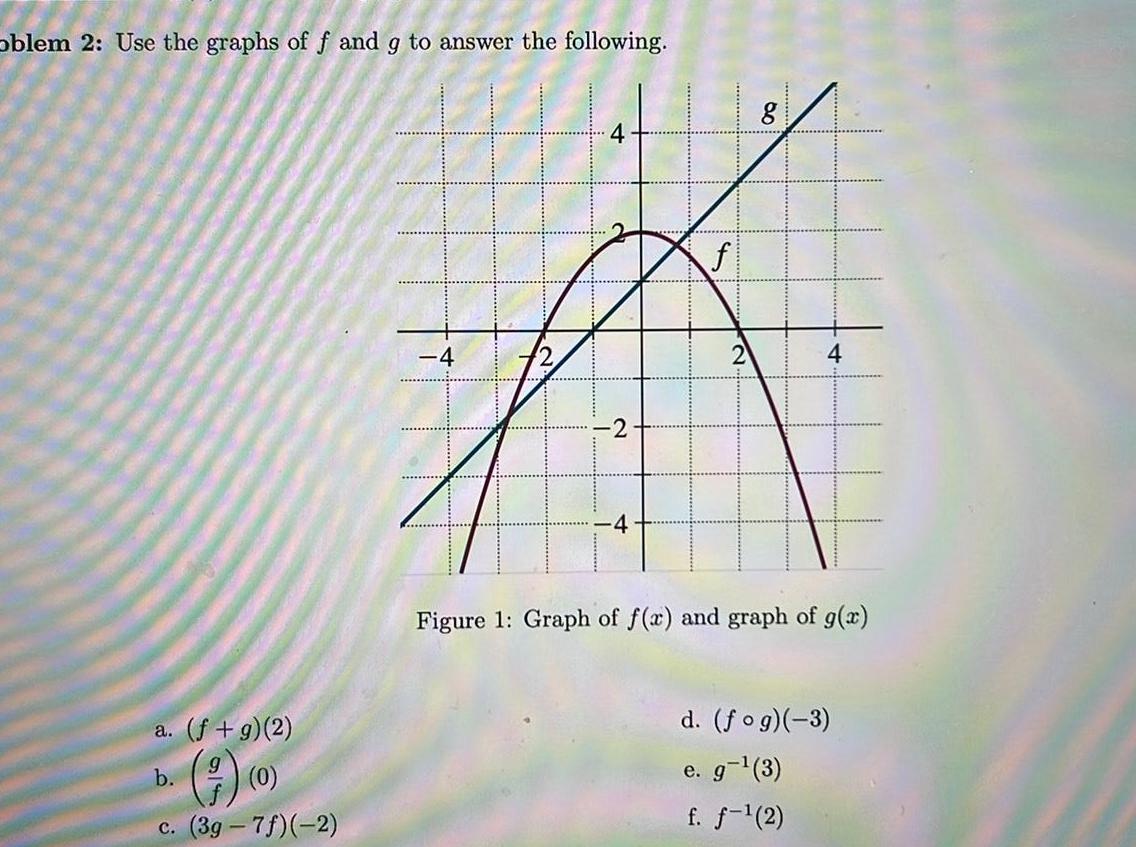
Application of derivativesoblem 2 Use the graphs of f and g to answer the following a f g 2 b c 3g 7f 2 4 4 2 4 f 8 4 Figure 1 Graph of f x and graph of g x d fog 3 e g 3 f f 2
Calculus
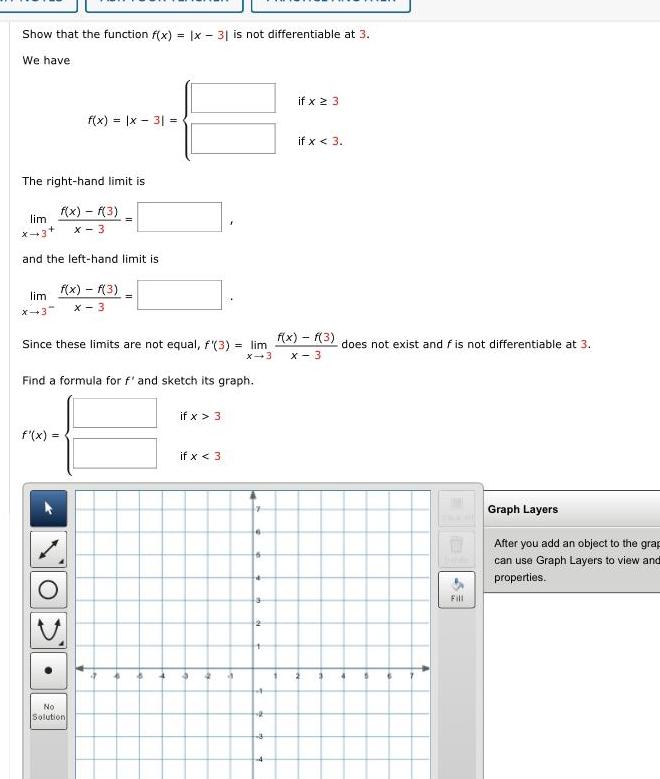
Application of derivativesShow that the function f x x 31 is not differentiable at 3 We have The right hand limit is f x f 3 x 3 lim X 3 f x x 3 and the left hand limit is lim f x f 3 X 3 X 3 Find a formula for f and sketch its graph f x Since these limits are not equal f 3 lim f x f 3 does not exist and f is not differentiable at 3 X 3 x 3 No Solution 2 if x 3 if x 3 4 4 a 6 2 a 3 if x 23 if x 3 2 3 4 Fill Graph Layers After you add an object to the grap can use Graph Layers to view and properties
Calculus
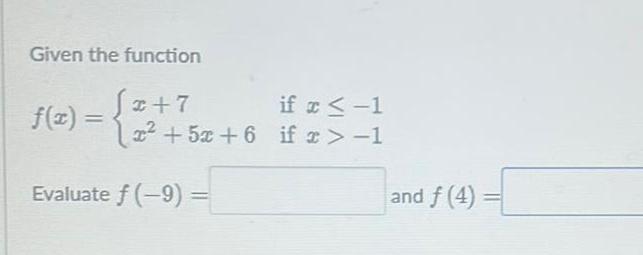
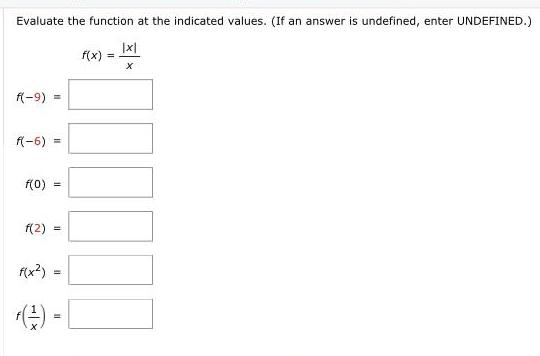
Application of derivativesEvaluate the function at the indicated values If an answer is undefined enter UNDEFINED x X f 9 f 5 f 0 f 2 f x f f x
Calculus
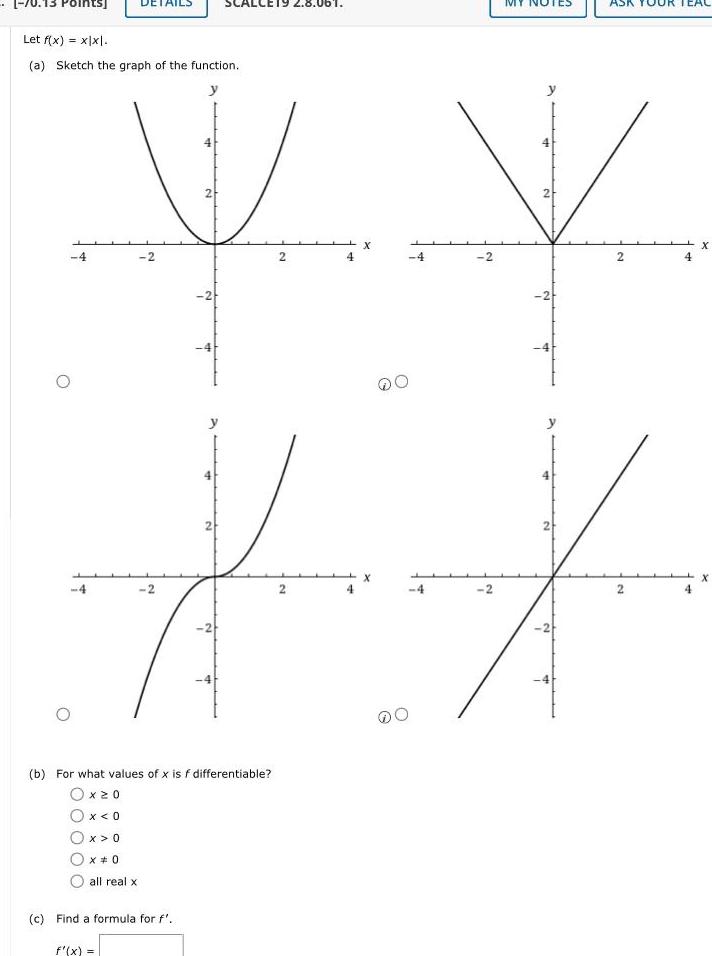
DifferentiationLet f x xlxl a Sketch the graph of the function y 2 V 4 2 2 2 2 c Find a formula for f f x y ALCE19 2 8 061 2 b For what values of x is f differentiable Oxz0 Ox 0 Ox 0 0 all real x 2 X 4 X 4 4 2 2 y 4 N 2 T y 2 2 2 X X
Calculus
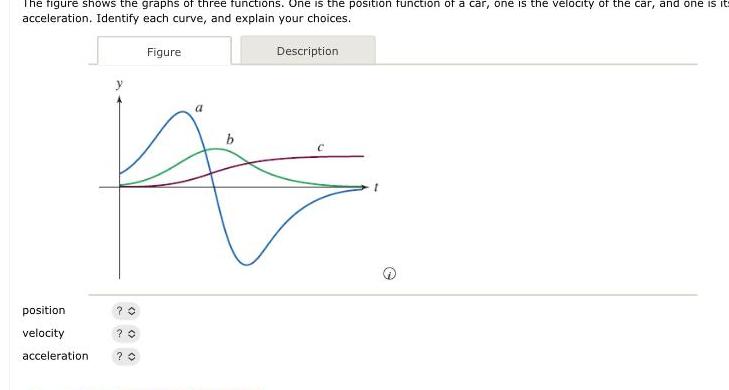
Application of derivativesThe figure shows the graphs of three functions One is the position function of a car one is the velocity of the car and one is it acceleration Identify each curve and explain your choices position velocity acceleration Figure 20 0 0 Description b A
Calculus
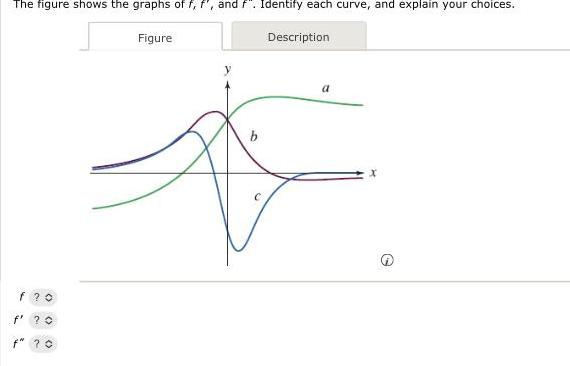
Application of derivativesThe figure shows the graphs of f f and f Identify each curve and explain your choices f 0 H f O f 70 Figure b Description a
Calculus
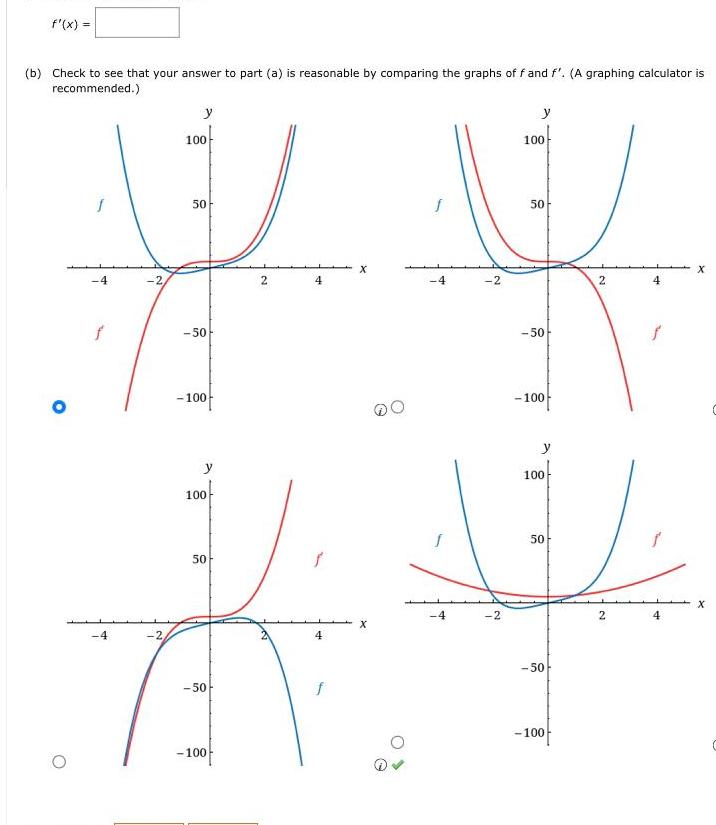
Differentiationf x b Check to see that your answer to part a is reasonable by comparing the graphs of f and f A graphing calculator is recommended 4 f 4 2 2 y 100 50 50 100 y 100 50 50 100 2 4 4 f X S 4 4 2 2 y 100 50 50 100 y 100 50 50 100 2 2 4 4 X X