Statistics Questions and Answers

Statistics
StatisticsWith 95 confidence interval and n 12 Find right critical value for Zinterval O2 201 O 1 796 01 96

Statistics
StatisticsTest the claim that the mean GPA of night students is smaller than 3 5 at the 0 10 significance level The null and alternative hypotheses would be Ho 3 5 Ho p 0 875 Ho 3 5 Ho p 0 875 Ho 3 5 Ho p 0 875 H 3 5 H p 0 875 H 3 5 H p0 875 H 3 5 H p 0 875 O O The test is two tailed right tailed left tailed Based on a sample of 35 people the sample mean GPA was 3 48 with a standard deviation of 0 06 The p value is The significance level is Based on this we O Reject the null hypothesis Fail to reject the null hypothesis to 3 decimals to 2 decimals

Statistics
StatisticsIn a poll Australians were asked if they thought unemployment would increase At that time 284 out of 605 said that they thought unemployment would increase Estimate the proportion of Australians who believed unemployment would increase using a 99 confidence interval Round to three decimal places With that Australians who believed unemployment would increase is between and confidence we can conclude that the true proportion of defects

Statistics
StatisticsAn economist wondered if people who go to the movies on weekdays go more or less often on Fridays than any other day She figured that if it were truly random 20 of these movie goers would go on Fridays She randomly sampled 50 people who go to movies on weekdays and asked them on which d y they attend movies most frequently Of those sampled 14 indicated that they go on Fridays more often than other days The economist conducts a one proportion hypothesis test at the 5 significance level to test whether the true proportion of weekday movie goers who go most frequently on Fridays is different from 20 For this test Ho p 2 Ha p 2 Find the test statistic Find the p value Round to three decimal places Found to three decimal places

Statistics
StatisticsAccording to a recent study the mean number of hours college students spent studying per month was 75 hours with a population standard deviation of 25 hours Two weeks before final exams were scheduled to begin 100 college students were randomly selected Use a calculator and central limit theorem to find the probability that the mean number of hours spent studying is less than 70 hours Round your answer to three decimal places if necessary 14x

Statistics
StatisticsThe diameters of apples from a certain farm follow the normal distribution with mean 4 inches and standard deviation 0 4 inch Apples can be size sorted by being made to roll over mesh screens First the apples are rolled over a screen with mesh size 3 5 inches This separates out of all the apples with diameters less than 3 5 inches Second the remaining apples are rolled over a screen with mesh size 4 3 inches During that first step what proportion of apples have a diameter of less than 3 5 inches Round your answer to four decimal places

Statistics
StatisticsThe amount of time it takes Emma to wait for the train is continuous and Uniformly distributed between 4 minutes and 11 minutes What is the probability that it take Emma more than 5 minutes to wait for the train O3 14 5 14 O 4 7 O 5 7 O 6 7

Statistics
StatisticsThe city council conducts a survey of the city s residents to determine which services are most used by the community 60 of the residents say that they use the library and 35 of the residents say they use the library and the recycling center What is the probability that a resident uses the recycling center given that they use the library Express your answer as a decimal rounded to three decimal places

Statistics
StatisticsSarah has two tests at school next week a math test and a physics test Let A represent the event that she passes her math test and B represents the event that she passes her physics test If A and B are independent events with P A 0 30 and P A and B 0 21 find P B Give your answer as a decimal rounded to two decimal places

Statistics
StatisticsThe owner of a radio station wants to determine how much airtime songs take up The owner collects the song length in seconds of 10 population songs The data are reproduced in the table below Calculate the mode s using a TI 83 TI 83 plus or Tl 84 graphing calculator 279 219 298 134 206 293 165 227 230 212 O There are two modes The modes are 134 and 298 O There is one mode The mode is 223 O There is one mode The mode is 298 O There is no mode

Statistics
Statistics34 According to a recent report customers who shop at a certain online store spend on average 1 500 a year at the store To investigate whether the mean amount spent was greater than the reported average an economist obtained the mean and standard deviation of the amount spent in the past year by a random sample of 120 customers who shop at the store With all conditions for inference met the economist conducted the appropriate hypothesis test and obtained a p value of 0 25 Which of the following statements is the most appropriate conclusion for the investigation A There is convincing statistical evidence that the mean amount of money spent each year by all customers who shop at the store is 1 500 B There is convincing statistical evidence that the mean amount of money spent each year by all customers who shop at the store is greater than 1 500 C There is convincing statistical evidence that the mean amount of money spent each year by all customers who shop at the store is less than 1 500 D There is not convincing statistical evidence that the mean amount of money spent each year by all customers who shop at the store is greater than 1 500 E There is not convincing statistical evidence that the mean amount of money spent each year by any sample of 120 customers who shop at the store is greater than 1 500

Statistics
Statisticsestion 6 Dollar General has increased their number of stores tremendously over t decade In 2020 there were 17 266 Dollar General stores this total was up 30 from the number of stores in 2016 Use this information to calculate the number of Dollar General stores in 2016 How many Dollar General stores were added from 2016 to 2020 3984 stores 7400 stores 5180 stores 30 stores 5179 stores al of 110 minutes of rain Ch

Statistics
StatisticsStatistics students believe that the mean score on a first statistics test is 65 The instructor thinks that the mean score is higher She samples 10 statistics students and obtains the scores Grades 64 3 62 7 83 2 88 61 9 96 64 3 74 4 69 65 Test grades are believed to be normally distributed Use a significance level of a 5 critical value to to 05 1 8331 A State the alternative hypothesis HA O 65 O 65 O 65

Statistics
StatisticsHypothesis testing concepts For a test of Ho p 0 60 the test statistic is determined to be z 2 11 a If the alternative hypothesis is Ha p 0 60 The P value is four decimal places b If the alternative hypothesis is Ha p 0 60 The P value is four decimal places round to round to

Statistics
StatisticsA scientist claims that in a population of fish at least 54 are female A test is conducted to test the claim Identify the null hypothesis Ho O 0 0 54 Identify the alternative hypothesis 20 0 54 Par HA

Statistics
StatisticsPart 1 o A sociologist claims the probability that a person picked at random in Times Square in New York City is visiting the area is no less than 0 67 Maji wants to test the claim Identify the null hypothesis H 0 67 Identify the alternative hypothesis H 0 0 67

Statistics
StatisticsHo p 0 84 H p 0 84 Your sample consists of 51 subjects with 45 successes Calculate the test statistic rounded to 2 decima places Z
Statistics
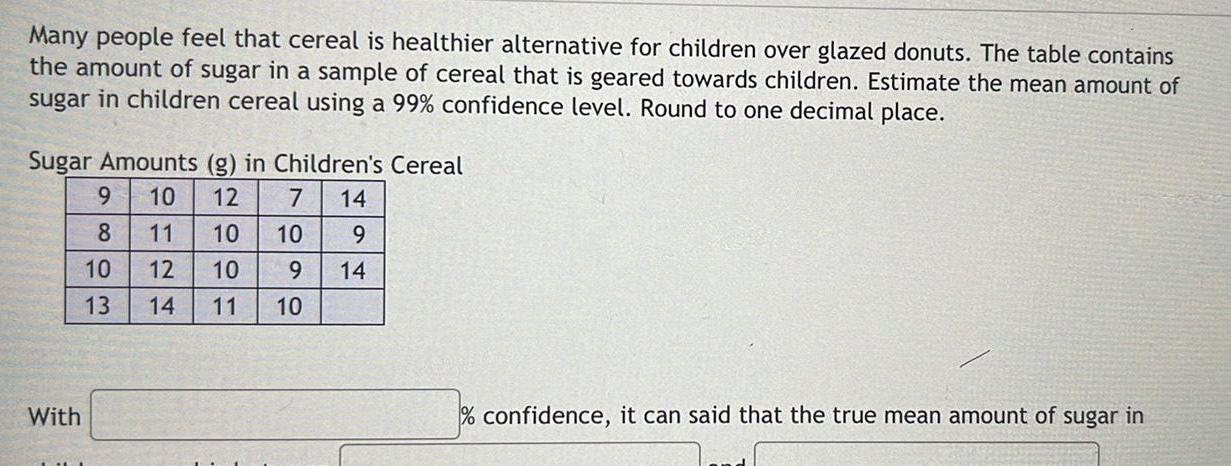
StatisticsMany people feel that cereal is healthier alternative for children over glazed donuts The table contains the amount of sugar in a sample of cereal that is geared towards children Estimate the mean amount of sugar in children cereal using a 99 confidence level Round to one decimal place Sugar Amounts g in Children s Cereal 10 12 7 14 9 14 With 9 803 10 H2H 11 10 10 12 00 10 9 13 14 11 10 confidence it can said that the true mean amount of sugar in

Statistics
StatisticsContinuous is the type of quantitative data that is the result of measuring O True False


Statistics
StatisticsA random sample of house sizes in major city has a sample mean of 1204 9 square feet and a sample standard deviation of 124 6 square feet Use the Empirical rule to determine the approximate percentage of house sizes that lie between 955 7 and 1454 1 square feet Round your answer to the nearest whole number percent

Statistics
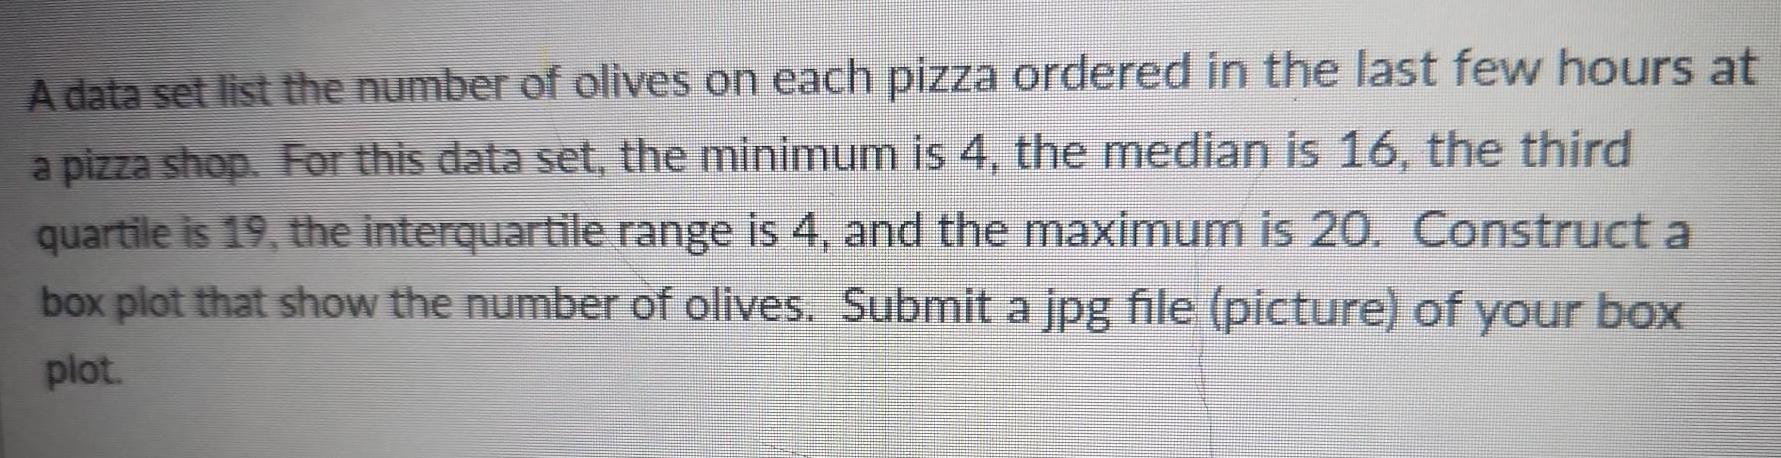
StatisticsA data set list the number of olives on each pizza ordered in the last few hours at a pizza shop For this data set the minimum is 4 the median is 16 the third quartile is 19 the interquartile range is 4 and the maximum is 20 Construct a box plot that show the number of olives Submit a jpg file picture of your box plot

Statistics
StatisticsSuppose you compute a 99 confidence interval What will happen to the confidence interval if you change the confidence level to 95 The confidence interval will become Select an answer if the confidence level is changed from 99 to 95 Select an answer Next Question narrower wider

Statistics
StatisticsWhen considering different sampling methods cluster sampling includes the steps O Identify individuals of the poulation that are easily accessible obtain data from these individuals O list the members of the population use simple random sampling to select a starting point in the population let k number of individuals in the population number of individuals needed in the sample choose every kth individual in the list starting with the one that was randomly selected O divide the population into groups use simple random sampling to identify a proportionate number of individuals form each group use simple random sampling to select a set of groups every individual in the chosen groups is included in the sample

Statistics
StatisticsTimothy wants to estimate the mean number of siblings for each student in his school He records the number of siblings for each 75 randomly selected students in the school What is the statistic O the mean number of siblings for the randomly selected students O the specific number of siblings for each randomly selected student O the 75 randomly selected students the mean number of siblings for all students in the school all the students in the school

Statistics
StatisticsAccording to a study conducted by a statistical organization the proportion of people who are satisfied with the way things are going in their lives is 0 74 Suppose that a random sample of 100 people is obtained Complete parts a through e below a Suppose the random sample of 100 people is asked Are you satisfied with the way things are going in your life Is the response to this question qualitative or quantitative Explain CIXD OA The response is quantitative because the number of people satisfied can be counted OB The response is qualitative because the number of people satisfied can be counted OC The response is qualitative because the responses can be classified based on the characteristic of being satisfied or not OD The response is quantitative because the responses can be classified based on the characteristic of being satisfied or not b Explain why the sample proportion p is a random variable What is the source of the variability OA The sample proportion p is a random variable because the value of p varies from sample to sample The not be responding to the question truthfully vari is due to the fact that people OB The sample proportion p is a random variable because the value of p varies from sample to sample The variability is due to the fact that different people feel differently regarding their satisfaction OC The sample proportion p is a random variable because the value of p repr sents a random person included in the sample The variability is due to the fact that people may not be responding to the question truthfully OD The sample proportion p is a random variable because the value of p represents a random person included in the sample The variability is due to the fact that different people feel differently regarding their satisfaction c Describe the sampling distribution of p the proportion of people who are satisfied with the way things are going in their life Be sure to verify the model requirements Since the sample size is than 5 of the population size and np 1 P 21 10 the distribution of p is and G P with th Hp Round to three decimal places as needed d In the sample obtained in part a what is the probability that the proportion who are satisfied with the way things are going in their life exceeds 0 78 The probability that the proportion who are satisfied with the way things are going in their life exceeds 0 78 is Round to four decimal places as needed e Using the distribution from part c would it be unusual for a survey of 100 people to reveal that 68 or fewer people in the sample are satisfied with their lives The probability that 68 or fewer people in the sample are satisfied is which probability less than Round to four decimal places as needed unusual because this

Statistics
StatisticsOn each blank below write in the probability that corresponds to the problem number in the tree diagram 1pt each 12 0 68 13 0 32 15 044 16 0 18 14 0 49 17 0 82 18 Use the tree diagram to calculate the probability that the Eagles win the game when going for it on 4th down Total probability to win the game when they Go for it If the Eagles have a 0 68 probability of successfully gaining 1 or more yards is going for it a good strategy 3 pts USE PROBABILITY NOTH TION 19 What does it mean to have a value of 0 367 win probability in this context 3 pts 20 If there is a 0 68 probability of being successful on 4th down and 1 yard to go should teams always go for

Statistics
StatisticsRate 2 1 3 4 6 5 below a Calculate the coefficient of correlation r 2 sses the unemployment rate decreases Please note that this data is graphed b Using the coefficient of correlation describe the strength and direction of this relationship 2 c Using the least squares regression the following was calculated a 0 3167 b 634 35 Plot this line of best fit on your scatter plot 2 d Based on this model what would you predict the unemployment rate to be in 1998 1 Year 1990 1991 1992 1993 1994 1995 1996 1997 15948 Unemployment Rate 5 3 3 4 2 9 2 7 2 7 3 2 5 2 1 24 6 x 3960100 3964081 3968064 3972049 3976036 3980025 3984016 3988009 31792380 y xy 28 09 10547 11 56 6769 4 8 41 5776 8 7 29 5381 1 7 29 5383 8 9 5985 6 25 4990 4 41 4193 7 82 3 49026 8 Unemployment Rate 0 1990 1991 1992 1993 1994 1995 1996 1997 1998

Statistics
StatisticsA group on campus will make and sell bracelets to benefit a charity The profit from selling the bracelets will go to the charity The group members are trying to decide how much to charge x for each bracelet so they took a survey to find out how many bracelets f x they would sell when the price per bracelet was x dollars Here is what their data shows X f x 500 375 350 225 150 2 4 5 5 7 5 9 A Write a linear equation for f x according to the values in the table y 2 pts B Fill in the blanks to explain the meaning of the slope in the context of the bracelet sales When the increases by x one dollar the number of bracelets by 3 pts C Explain the meaning of the y intercept in the context of the

Statistics
StatisticsSection 1 Arithmetic Question 7 Bob deposits 20 of 140 into a savings account what is the amount of his deposit Q 10 T R 16 S 20 T 28

Statistics
StatisticsIn a stadium the ratio of home fans to visiting fans in a crowd is 11 1 Which of the following could be the total number of fans in the stadium I 12 324 J 42 326

Statistics
StatisticsA football team had 20 000 to spend on supplies The team spent 15 000 on new balls New sport shoes cost 140 each Which of the following inequalities represent th number of new shoes the team can purchase U 140x 15 000 20 000 V 140x 15 000 20 000 W 15 000x 140 20 000 X 15 000x 140 20 000

Statistics
StatisticsIon 18 What is 720 756 rounded to the nearest hundredth A 720 B 720 75 C 720 76 D 721

Statistics
StatisticsQuestion 28 If 4x y 25 and x 2z 24 what is the value of x A 0 B 5 C 10 D It cannot be determined from the information given

Statistics
StatisticsIf 60 of x equal to 30 of 20 then what is the value of x 5 A 25 25 B 26 C 26 01 D 225


Statistics
StatisticsThe ratio of boys and girls in a class is 3 8 If there are 55 students in the class how m more boys should be enrolled to make the ratio 1 1 Y 6 Z 18 AA 20 BB 25 0002 20 140 20 000 20 000

Statistics
Statisticstive Reasoning Algebra And Statistics Question 29 dvem The average of 6 numbers is 15 The average of 4 of those numbers is 10 What is the average of the other two numbers Q 10 R 12 S 14 T 25 000 00 0000025

Statistics
StatisticsQuestion 38 Michelle and Alec can finish a job together in 100 minutes If Michelle can do the job by herself in 5 hours how many minutes does it take Alec to finish the job A 190 cm B 180 cm C 160 cm D 150 cm

Statistics
Statisticscrivez votre r ponse aux questions d veloppement dans l espace pr vu ci dessous en pr cisant clairement votre notation et en incluant une justification appropri e Montrez tous les d tails de vos calculs 1 En hiver en Am rique du Nord les harfangs des neiges migrent vers le sud tous les quatre ans en plus grand nombre La taille du corps des harfangs des neiges suit une distribution normale avec une moyenne de 61 5 cm et un cart type de 4 75 cm a 5 points Quelle est la probabilit que la taille d un harfang des neiges soit sup rieure 52 cm b 5 points Si nous s lectionnons au hasard 10 harfangs des neiges dans cette population quel est le nombre attendu de harfangs des neiges dans l chantillon dont la taille est comprise entre 46 3 cm et 52 cm

Statistics
StatisticsIn the probability distribution to the right the random variable X represents the number of hits a baseball player obtained in a game over the course of a season Complete parts a through 1 below O A Probability 0 4 0 34 0 2 0 1 0 44 0 1 2 3 4 5 Number of Hits Q O B Probability 0 4 0 3 0 2 0 1 ol 0 1 2 3 4 5 Number of Hits Q O C Probability Describe the shape of the distribution The distribution has one mode and is c Compute and interpret the mean of the random variable X Hx 1 6285 hits Type an integer or a decimal Do not round Which of the following interpretations of the mean is correct 0 4 0 3 0 24 0 1 0 1 2 3 4 5 Number of Hits Probability 02 0 1 1 X 0 0 1 2 0 41 0 3 Q 3 4 5 10 P x D 0 3 Type an integer or a decimal Do not round f What is the probability that in a randomly selected game the player got more than 1 hit 0 1661 0 3357 0 2878 0 1492 0 0364 0 0248 0 1 2 3 4 5 Number of Hits 57 OA The observed number of hits per game will be equal to the mean number of hits per game for most games OB In any number of games one would expect the mean number of hits per game to be the mean of the random variable OC Over the course of many games one would expect the mean number of hits per game to be the mean of the random variable D The observed number of hits per game will be less than the mean number of hits per game for most games d Compute the standard deviation of the random variable X Ox 1 175 hits Round to three decimal places as needed e What is the probability that in a randomly selected game the player got 2 hits
Statistics
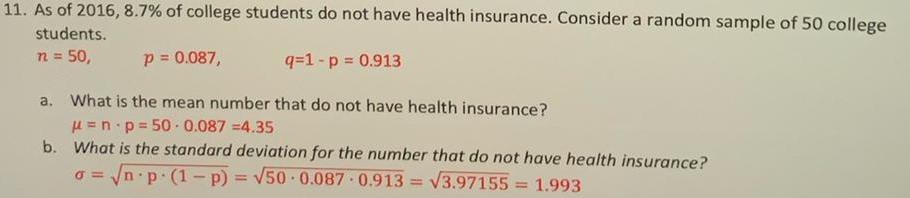
Statistics11 As of 2016 8 7 of college students do not have health insurance Consider a random sample of 50 college students n 50 p 0 087 q 1 p 0 913 a What is the mean number that do not have health insurance n p 50 0 087 4 35 b What is the standard deviation for the number that do not have health insurance 0 n p 1 p 50 0 087 0 913 3 97155 1 993

Statistics
StatisticsHow many weeks of data must be randomly sampled to estimate the mean weekly sales of a new line of athletic footwear We want 90 confidence that the sample mean is within 400 of the population mean and the population standard deviation is known to be 1 200 1 645 1200 2 400 n n 24 4 n 25 weeks

Statistics
Statisticspoint s possible In a survey conducted by a reputable marketing agency 268 of 1000 adults 19 years of age or older confessed to bringing and using their cell phone every trip to the bathroom confessions included texting and answering phone calls Complete parts a through f below Click here to view the standard normal distribution table page 1 Click here to view the standard normal distribution table page 2 a What is the sample in this study What is the population of interest Determine the sample in this study Select the correct choice below and if necessary fill in the answer box within your choice A The sample is the 268 adults 19 years of age or older Type a whole number OB The sample is all adults OC The sample is all adults with a cell phone OD The sample is all adults 19 years of age or older Determine the population of interest Select the correct choice below and if necessary fill in the answer box within your choice OA The population is all adults OB The population is all adults with a cell phone OC The population is the adults 19 years of age or older Type a whole number OD The population is all adults 19 years of age or older b What is the variable of interest in this study Is it qualitative or quantitative The variable of interest is because Submit test c Based on the results of this survey obl who bring their cell phone every trip to the p 1000 Round to three decimal places as needed in point estimate found in This variable is numerical measures of individuals are provided individuals are classified based on a characteristic or olde it is th

Statistics
Statistics11 12 13 14 7 CALLE 8 15 16 10 17 18 19 20 9 21 24 22 AVEN 23 25 6 4 5 2 3 You can use your graphical calculator Excel or other software to analyze the data Upload the completed document in the third assignment of the project question 1 Weekday Mean Standard Deviation Weekend day Mean 26 Standard Deviation 27 28 2 3 1 2 3 1 4 4 5 8 9 100 6 7 Breakfast calories Lunch calories 389 389 389 389 389 368 368 368 565 368 398 2 59 5293 Breakfast calories Lunch calories 539 47 684 565 458 75 281 6645 320 699 780 699 699 1668 1189 870 740 710 837 4 360 3641 470 1700 350 543 765 75 627 8951 Dinner calories 830 470 660 470 510 648 707 351 391 444 548 1 154 6447 Dinner Calories 700 257 800 700 614 25 242 7871 Snack calories 276 Snack Calories 175 680 175 175 175 769 175 87 699 338 6 265 1483 330 0 0 186 258 101 8234 Total Calories for the day 1815 1732 2509 1733 1773 2859 3033 1764 1783 2221 2238 8 577 2134 Total Calories for the day 2039 2004 1834 1994 1967 75 91 2300 Only Wee 11 Me Sta W M Sta

Statistics
StatisticsClayton Kershaw of the Los Angeles Dodgers is one of the premier pitchers in baseball His most popular pit a four seam fastball The accompanying data represent the pitch speed in miles per hour for a random sample of 15 of his four seam fastball pitches Complete parts a through f Click here to view the data table Click here to view the standard normal distribution table page 1 Click here to view the standard normal distribution table page 2 Click here to view the table of critical t values Click here to view a table of critical values for the correlation coefficient Since the absolute value of the correlation coefficient between the expected z scores and the ordered observed data is reasonable to conclude that the data come from a 0 994 the critical value 0 514 it exceeds population that is normally distributed Round to three decimal places as needed c Draw a boxplot to verify the data set has no outliers Which boxplot below represents the data OA OB 90 95 Speed mph 100 An interval Q 90 95 Speed mph 100 E be constructed because the data O C OD The interval cannot be found 90 OB 95 of Kershaw s four seam fastballs are between 95 Speed mph 100 The interval for all pitchers in a league would be Q O D d Are the requirements for constructing a confidence interval for the mean pitch speed of Clayton Kershaw s four seam fastball satisfied 90 approximately normal and there e Construct and interpret a 95 confidence interval for the mean pitch speed of Clayton Kershaw s four seam fastball Select the correct choice below and if necessary fill in the answer boxes to complete your choice OA There is a 95 probability that the mean pitch speed of Kershaw s four eam fastball is between miles per hour Round to two decimal places as needed Use ascending order than the variability between pitches for one pitcher 95 100 Speed mph miles per hour and Round to two decimal places as needed Use ascending order OC One can be 95 confident that the mean pitch speed of Kershaw s four seam fastball is between miles per hour Round to two decimal places as needed Use ascending order Q and f Do you believe that a 95 confidence interval for the mean pitch speed of four seam fastballs for all major league pitchers would be narrower or wider Why and because the variability between pitchers is most likely

Statistics
StatisticsA certain drug can be used to reduce the acid produced by the body and heal damage to the esophagus due to acid reflux The manufacturer of the drug claims that more than 92 of patients taking the drug are healed within 8 weeks In clinical trials 215 of 232 patients suffering from acid reflux disease were healed after 8 weeks Test the manufacturer s claim at the x 0 1 level of significance Because npo 1 Po Round to one decimal place as needed What are the null and alternative hypotheses Ho versus H Type integers or decimals Do not round Find the test statistic Zo Zo 10 the sample size is Find the P value 5 of the population size and the sample satisfied the requirements for testing the hypothesis Round to two decimal places as needed P value Round to three decimal places as needed Choose the correct conclusion below O A Reject the null hypothesis There is sufficient evidence to conclude that more than 92 of patients taking the drug are healed within 8 weeks O B Do not reject the null hypothesis There is sufficient evidence to conclude more than 92 of patients taking the drug are healed within 8 weeks OC Reject the null hypothesis There is insufficient evidence to conclude that more than 92 of patients taking the drug are healed within 8 weeks O D Do not reject the null hypothesis There is insufficient evidence to conclude that more than 92 of patients taking the drug are healed within 8 weeks

Statistics
StatisticsA credit score is used by credit agencies such as mortgage companies and banks to assess the creditworthiness of Individuals Values range from 300 to 850 with a credit score over 700 considered to be a quality credit risk According to a survey the mean credit score is 707 2 A credit analyst wondered whether high income individuals incomes in excess of 100 000 per year had higher credit scores He obtained a random sample of 33 high income individuals and found the sample mean credit score to be 725 3 with a standard deviation of 80 9 Conduct the appropriate test to determine if high income individuals have higher credit scores at the a 0 05 level of significance State the null and alternative hypotheses H i H H P Type integers or decimals Do not round Identify the t statistic to Round to two decimal places as needed Identify the P value P value Round to three decimal places as needed Make a conclusion regarding the hypothesis the null hypothesis There of high income individuals is sufficient evidence to claim that the mean credit score

Statistics
StatisticsTotal Sugar Total Sodium 173 5 1542 105 9 5 145 100 3 625 106 5 145 114 6 355 161 4 996 117 3 407 107 2 066 67 3 366 89 2 255 7000 6000 5000 4000 3000 2000 1000 0 0 2 1542 5 145 Find the correlation coefficient r for the previous problem Round to two decimal places Is this a weak moderate or strong correlation Scatter Plot 3 625 If it is a weak correlation speculate as to why their ion and sodium consumption has a 5 145 173 5 105 9 100 106 114 161 117 4 8 6 355 6 4 996 Total Sugar Total Sodium 3 407