Statistics Questions and Answers

Statistics
StatisticsYoung s modulus is a quantitative measure of stiffness of an elastic material Suppose that for aluminum alloy sheets of a particular type its mean value and standard deviation are 70 GPa and 1 6 GPa respectively values given in the article Influence of Material Properties Variability on Springback and Thinning in Sheet Stamping Processes A Stochastic Analysis Intl J of Advanced Manuf Tech 2010 117 134 a If X is the sample mean Young s modulus for a random sample of n 64 sheets where is the sampling distribution of X centered and what is the standard deviation of the X distribution E X GPa GPa 0x b Answer the questions posed in part a for a sample size of n 256 sheets E X ox GPa GPa c For which of the two random samples the one of part a or the one of part b is X more likely to be within 1 GPa of 70 GPa Explain your reasoning OX is more likely to be within 1 GPa of the mean in part a This is due to the decreased variability of X that comes with a smaller sample size OX is more likely to be within 1 GPa of the mean in part b This is due to the decreased variability of X that comes with a larger sample size X is more likely to be within 1 GPa of the mean in part b This is due to the increased variability of X that comes with a larger sample size OX is more likely to be within 1 GPa of the mean in part a This is due to the increased variability of X that comes with a smaller sample size

Statistics
StatisticsMatch the histograms on the right to the summary statistics given IV Mean 59 69 59 59 a AR b d Median 59 69 59 59 Standard Deviation 2 2 11 10 19 Frequency Frequency Frequency ncy 54 56 58 60 62 64 a 10 29 39 49 59 69 79 89 b 20 10 44 10 54 64 74 c 84 94 Q Q 5 O

Statistics
Statisticsto the ren Click t mean i Table of numbers of girls and probabilities Number of Girls x 0 12345678 P x 0 002 0 025 0 119 0 224 0 266 0 224 0 105 0 029 0 006 X e random variable x represents the number of

Statistics
StatisticsAfter giving a statistics exam Professor Dang determined the following five number summary for her class results 55 63 73 86 95 Use this information to draw a boxplot of the exam scores Choose the correct graph below OA 60 Scores 80 Percent 100 5 O B 60 Scores 80 Percent 100 Q Q O C 60 Scores 80 Percent 100 Q 2

Statistics
StatisticsOne year Todd had the lowest ERA earned run average mean number of runs yielded per nine innings pitched of an male pitcher at his school with an ERA of 3 25 Also Betty had the lowest ERA of any female pitcher at the school with an ERA of 3 24 For the males the mean ERA was 3 928 and the standard deviation was 0 964 For the females the mean ERA was 3 882 and the standard deviation was 0 776 Find their respective z scores Which player had the bette year relative to their peers Todd or Betty Note In general the lower the ERA the better the pitcher Todd had an ERA with a z score of Betty had an ERA with a z score of Round to two decimal places as needed Which player had a better year in comparison with their peers OA Todd had a better year because of a lower z score OB Todd had a better year because of a higher z score OC Betty had a better year because of a higher z score OD Betty had a better year because of a lower z score

Statistics
StatisticsIn a rugby match a tie at the end of two overtime periods leads to a shootout with five kicks taken by each team from the center of the 22 meter line Each kick must be taken by a different player How many ways can 5 players be selected from the 15 eligible players For the 5 selected players how many ways can they be designated a first second third fourth and fifth 5 players can be selected from the 15 eligible players in first second third fourth and fifth in different ways Type whole numbers CEED different ways Out of those 5 players that are selected they can be designated as

Statistics
StatisticsComplete the paragraph The standard deviation is used in conjunction with the The distribution measures the center of the distribution while the standard deviation measures the Choose the correct answers below The standard deviation is used in conjunction with the shaped The of the distribution to numerically describe distributions that are bell shaped of the XXXS to numerically describe distributions that are bell measures the center of the distribution while the standard deviation measures the

Statistics
StatisticsWhat does the symbol I represent The five starting players of an NBA basketball team can stand in a line 51 different ways so what is the actual number of ways that the tive players can stand in a line ED What does the symbol I represent A The symbol I is the factorial symbol It represents the product of decreasing positive whole numbers OB The symbol I is the symbol for the multiplication counting rule It is used to find the total number of possibilities from some sequence of events OC The symbol I is the permutation symbol It represents items as arrangements in which different sequences of the same items are counted separately OD The symbol I is the combinations symbol It represents items as arrangements in which different sequences of the same items are counted as being the same The five starting players of an NBA basketball team can stand in a line 51 different ways so what is the actual number of ways that the five players can stand in a line 51 Type a whole number

Statistics
Statistics65 The data represent the age of world leaders on their day of inauguration Find the five number summary and construct a boxplot for the data Comment on the shape of 68 the distribution 48 52 The five number summary is Use ascending order Choose the correct boxplot of the data below O A 30 40 50 60 70 80 90 5 O B TTT 30 40 50 60 70 80 90 2 Choose the correct description of the shape of the distribution O A The distribution is roughly symmetric OB The distribution is skewed to the left OC The distribution is skewed to the right D The shape of the distribution cannot be determined from the boxplot O C 43 69 53 65 62 67 57 67 T 30 40 50 60 70 80 90 44 54 61 Q Q

Statistics
StatisticsIn 1994 major league baseball players went on strike At the time the average salary was 1 049 589 and the median salary was 337 500 If you were representing the owners which summary would you use to convince the public that a strike was not needed If you were a player which would you use Why was there such a large discrepancy between the mean and median salaries Explain Select the correct answers below If you were representing the owners you would use the needed If you were a player you would use the average and median salaries differ so greatly because to convince the public that a strike was not to convince the public that a strike was needed The the distribution of salaries is skewed right the distribution of salaries is skewed left the mean is resistant to outliers but the median is not

Statistics
StatisticsExplain the meaning of the following percentiles in parts a and b a The 10th percentile of the weight of males 36 months of age in a certain city is 11 0 kg b The 90th percentile of the length of newborn females in a certain city is 54 3 cm a Choose the correct answer below OA 10 of males weigh 11 0 kg or less and 90 of 36 month old males weigh more than 11 0 kg OB 10 of 36 month old males weigh 11 0 kg or more and 90 of 36 month old males weigh less than 11 0 kg O C 10 of males weigh 11 0 kg or more and 90 of 36 month old males weigh less than 11 0 kg OD 10 of 36 month old males weigh 11 0 kg or less and 90 of 36 month old males weigh more than 11 0 kg b Choose the correct answer below OA 90 of females have a length of 54 3 cm or less and 10 of newborn females have a length that is more tha 54 3 cm OB 90 of newborn females have a length of 54 3 cm or less and 10 of newborn females have a length that is more than 54 3 cm OC 90 of newborn females have a length of 54 3 cm or more and 10 of newborn females have a length that is less than 54 3 cm OD 90 of females have a length of 54 3 cm or more and 10 of newborn females have a length that is less than 54 3 cm
Statistics
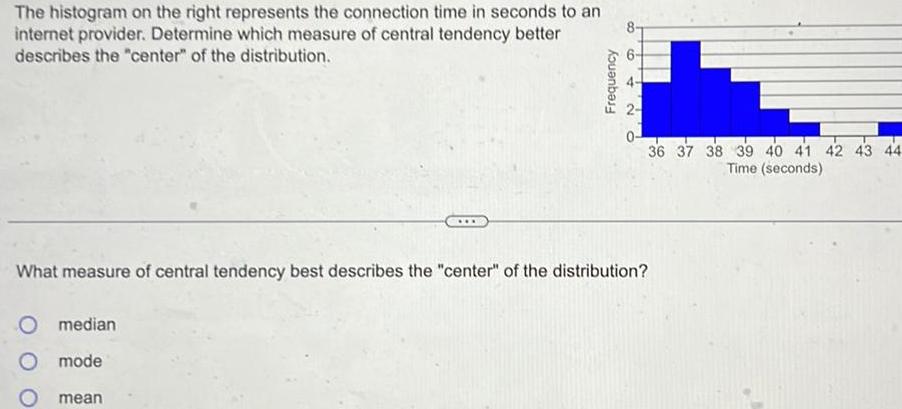
StatisticsThe histogram on the right represents the connection time in seconds to an internet provider Determine which measure of central tendency better describes the center of the distribution CO mean Frequency NA 0 36 37 38 39 40 41 42 43 44 Time seconds What measure of central tendency best describes the center of the distribution O median mode

Statistics
Statistics58 The data represent the age of world leaders on their day of inauguration Find the five number summary and construct a boxplot for the data Comment on the shape of 63 the distribution 48 55 The five number summary is 46 48 55 61 64 Choose the correct boxplot of the data below O A OB 40 50 60 70 Q 40 50 60 70 Q O C 40 50 64 61 46 49 62 50 47 55 60 70 56 52 48 Q Q

Statistics
StatisticsWhich of the accompanying boxplots likely has the data with the larger standard deviation Why Click the icon to view the boxplots Choose the correct answer below OA Boxplot I likely has the data with the larger standard deviation because the values associated with Boxplot I are larger than the values associated with Boxplot II which likely results in a larger standard deviation O B Boxplot I likely has the data with the larger standard deviation because the IQR is smaller than that of Boxplot II which likely results in a larger standard deviation OC Boxplot II likely has the data with the larger standard deviation because the boxplot appears to have a greater spread which likely results in a larger standard deviation O D Boxplot II likely has the data with the larger standard deviation because the median is less than the median of Boxplot I which likely results in a larger standard deviation

Statistics
Statisticsa Identify the shape of the distribution and b determine the five number summary Assume that each number in the five number summary is an integer 10 20 a Choose the correct answer below for the shape of the distribution OA The distribution is skewed right B The distribution is skewed left C The distribution is roughly symmetric D The shape of the distribution cannot be determined from the boxplot
Statistics
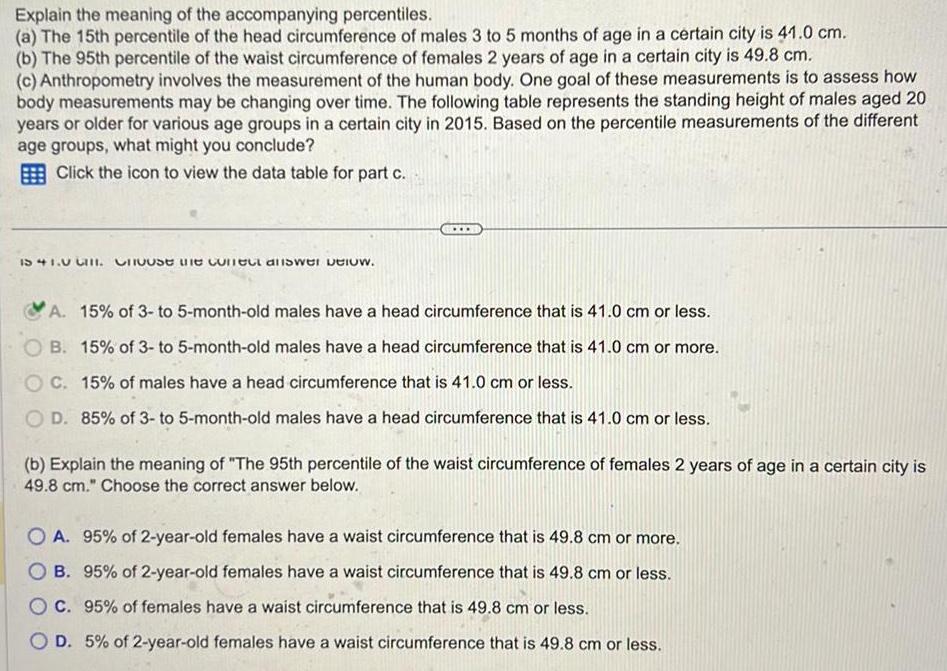
StatisticsExplain the meaning of the accompanying percentiles a The 15th percentile of the head circumference of males 3 to 5 months of age in a certain city is 41 0 cm b The 95th percentile of the waist circumference of females 2 years of age in a certain city is 49 8 cm c Anthropometry involves the measurement of the human body One goal of these measurements is to assess how body measurements may be changing over time The following table represents the standing height of males aged 20 years or older for various age groups in a certain city in 2015 Based on the percentile measurements of the different age groups what might you conclude Click the icon to view the data table for part c IS 41 G Choose the correct answer below A 15 of 3 to 5 month old males have a head circumference that is 41 0 cm or less OB 15 of 3 to 5 month old males have a head circumference that is 41 0 cm or more C 15 of males have a head circumference that is 41 0 cm or less OD 85 of 3 to 5 month old males have a head circumference that is 41 0 cm or less b Explain the meaning of The 95th percentile of the waist circumference of females 2 years of age in a certain city is 49 8 cm Choose the correct answer below OA 95 of 2 year old females have a waist circumference that is 49 8 cm or more B 95 of 2 year old females have a waist circumference that is 49 8 cm or less OC 95 of females have a waist circumference that is 49 8 cm or less OD 5 of 2 year old females have a waist circumference that is 49 8 cm or less

Statistics
StatisticsThe following graph is an ogive of a standardized test s scores The vertical axis in an ogive is the cumulative relative frequency and can also be interpreted as a percentile Complete parts a through c Percentile 100 80 60 40 20 Percentile Ranks of Test Scores 0 90 110 130 150 170 190 Test Score Q Q a Find and interpret the percentile rank of a test score with a value of 140 A test score of 140 corresponds to the th percentile rank since this percentage of test scores a test score with a are value of 140

Statistics
StatisticsExplain the circumstances for which the interquartile range is the preferred measure of dispersion What is an advantage that the standard deviation has over the interquartile range Choose the correct answer below O A The interquartile range is preferred when the distribution is symmetric An advantage of the standard deviation is that it is resistant to extreme values O B The interquartile range is preferred when the data are bell shaped An advantage of the standard deviation is that it increases as the dispersion of the data increases OC The interquartile range is preferred when the data are bell shaped An advantage of the standard deviation is that it is resistant to extreme values OD The interquartile range is preferred when the data are not skewed or no have outliers An advantage of the standard deviation is that it uses all the observations in its computation O E The interquartile range is preferred when the distribution is symmetric An advantage of the standard deviation is that it increases as the dispersion of the data increases O F The interquartile range is preferred when the data are skewed or have outliers An advantage of the standard deviation is that it uses all the observations in its computation

Statistics
StatisticsA manufacturer of bolts has a quality control policy that requires it to destroy any bolts that are more than 2 standard deviations from the mean The quality control engineer knows that the bolts coming off the assembly line have mean length of 14 cm with a standard deviation of 0 05 cm For what lengths will a bolt be destroyed Select the correct choice below and fill in the answer box es to complete your choice Round to one decimal place as needed OA A bolt will be destroyed if the length is less than OB A bolt will be destroyed if the length is greater than OC A bolt will be destroyed if the length is less than OD A bolt will be destroyed if the length is between cm or greater than cm cm cm and cm cm

Statistics
StatisticsWhat is meant by the phrase degrees of freedom as it pertains to the computation of the sample standard deviation Choose the correct answer below C A There are n 1 degrees of freedom in the computation of s because an unknown parameter is estimated by x For each parameter estimated 1 degree of freedom is lost OB The degrees of freedom refers to the number of observations that must be taken into account when computing the sample standard deviation s in order to ensure that the sum of the deviations about the mean is equal to zero OC There are n 1 degrees of freedom in the computation of the sample standard deviation s because it is obtained by dividing by n 1 OD There are n 1 degrees of freedom because the first n 1 observations have to be certain values in order for the nth value to have the freedom to be any value such that the sum of the deviations about the mean is equal to zero

Statistics
StatisticsChoose the three formulas that can be used to describe complementary events Select the three formulas that can be used to describe complementary events A P E 1 P E B P E 1 P E c P E P E 1 D P E P E 1 E P E OF P E P E G P E 1 P E 1 P E 1

Statistics
StatisticsIt is found that the home team was victorious in 70 games out of a sample of 120 games in the FA premier league a football soccer league in Great Britain We wish to investigate the proportion p of all games won by the home team in this league Click here to access StatKey Your answer is incorrect b State the null and alternative hypotheses for a test to see if there is evidence that the proportion is different from 0 5 f 41 A 42 p A Pi A P2 0 5 p iz E

Statistics
StatisticsImpact of Arts Education A randomized controlled experiment involving over 10 000 students enrolled in 4th to 8th grade in Texas examined the impact of arts education on a wide variety of outcomes Arts education included visual arts music dance and theater Six different outcomes were measured over 12 different groups for a total of 72 different hypothesis tests conducted to examine evidence for a positive impact from additional arts education Bowen D and Kisida B Investigating Causal Effects of Arts Education Experimental Evidence from Houston s Arts Access Initiative Research Report Kinder Institute for Urban Research February 12 2019 ii The other 24 tests were in the areas of discipline and writing For these 24 tests 15 were significant at the 5 level and 6 were significant at the 1 level At the 5 level Expected just by random chance i 2 7 Number of significant tests observed 15 At the 1 level Expected just by random chance i 0 54 Number of significant tests observed 6 Does increased arts education appear to have a statistically significant impact in these areas

Statistics
StatisticsThe dataset DecemberFlights contains the difference between actual and scheduled arrival time from 1000 randomly sample December flights for two of the major North American airlines Delta Air Lines and United Air Lines A negative difference indica flight arrived early Suppose that we are only interested in the proportion of flights arriving more than 30 minutes after the sc time Of the 1000 Delta flights 67 arrived more than 30 minutes late and of the 1000 United flights 160 arrived more than 30 late We are testing to see if this provides evidence to conclude that the proportion of flights that are over 30 minutes late is d between flying United or Delta Let group 1 be Delta flights and group 2 be United flights 4 Click here for the dataset associated with this question Use the second edition If using StatKey the data needed is preloaded as Late Arrival 2e Delta vs United 2014 Click here to access StatKey b What statistic will be recorded for each of the simulated samples to create the randomization distribution Statistic P H P2 a State the null and alternative hypotheses p x2 1 1 A p 42 2 A Pi p p A P P1 P1 r P2 P2 H p p HE I1

Statistics
StatisticsFind the standard error of mean 39 49 59 69 79 89 2 3 11 20 32 25 a Marks No of students 99 7

Statistics
StatisticsSuppose that a customer is purchasing a car He conducts an experiment in which he puts 10 gallons of gas in the car and drives it until it runs out of gas He conducts this experiment 15 times on each car and records the number of miles driven 219 253 259 244 162 260 237 268 257 240 201 304 Car 1 223 251 279 Car 2 233 296 324 215 296 252 Full data set 245 154 283 225 242 264 251 288 295 decimal place as needed Range for Car 2 R 170 mi 10 gal Type an integer or decimal rounded to one decimal place as needed Sample standard deviation for Car 1 s 23 0 mi 10 gal Type an integer or decimal rounded to one decimal place as needed Sample standard deviation for Car 2 s 49 9 mi 10 gal Type an integer or decimal rounded to one decimal place as needed Which car would the customer buy and why OA Car 1 because it has a lower sample standard deviation hence more predictable gas mileage O B Car 2 because it has a larger range of gas mileage O C Car 2 because it has a lower mean gas mileage

Statistics
StatisticsAr A soap manufacturing company was distributing a particular brand of soap through a large number of retail shops Before a heavy advertisement compaign the mean sales per week per shop was 140 dozens After the campaign a sample of 26 shops was taken and the mean sales was found to be 147 dozens with standard deviation 16 Can you consider the advertisement effective MUGLL 660 LOUD

Statistics
StatisticsWhich theory approaches medicine and health as health and the healthcare system are valuable resources that are unequally shared in society Structural Functionalist Conflict Theory O Symbolic interactionists O None of the Above

Statistics
StatisticsWhich theory approaches social institutions with the idea that social institutions represent the interests of those in power and thus create and maintain inequalities in society Structural Functionalist Conflict Theory O Symbolic interactionist None of the Above

Statistics
Statisticsapproaches religion focus on how religious meaning is constructed in interaction and how religion is incorporated into everyday life of individuals and groups Symbolic interactionism Conflict Theory Structural Functionalist O None of the Above
Statistics
StatisticsWhich theory approaches social change with the idea that social change involves changes in the meaning of things as well as changes in laws culture and social behavior O Conflict Theory Structural Functionalist Symbolic interactionism O No answer text provided

Statistics
StatisticsWhich theory approaches the natural environment with the notion that not all groups or individuals benefit equally from society s use of the natural environment Conflict Theory Structural Functionalist O Symbolic interactionism O None of the Above

Statistics
Statisticsviews outsourcing as exploiting poor and developing nation and laid off local workers all while enriching corporations Conflict Theory Structural Functionalist Symbolic interactionists None of the Above

Statistics
StatisticsWhich histogram depicts a higher standard deviation Frequency 10 8 6 0 30 40 50 60 70 a Choose the correct answer below Frequency 10 8 2 0 40 44 48 52 56 60 b Q Q Q OA Histogram a depicts the higher standard deviation B Histogram b depicts the higher standard deviation since it is more bell shaped because the distribution has more dispersion OC Histogram b depicts the higher standard deviation O D Histogram a depicts the higher standard deviatio because the bars are higher than the average bar because the distribution has more dispersion in a

Statistics
StatisticsIn a statistics class the standard deviation of the heights of all students was 3 8 inches The standard deviation of the heights of males was 3 4 inches and the standard deviation of females was 3 3 inches Why is the standard deviation of the entire class more than the standard deviation of the males and females considered separately Choose the correct answer below COL OA The distribution of the heights for the entire class generally has more spread than the distribution of the heights of the individual sexes OB The smaller sample size results in a smaller sample standard deviation OC There is more dispersion in the heights of the male and female samples than the heights of the entire class OD The sample sizes of the male students and female students are less than the sample size of the entire class

Statistics
StatisticsOver the past 10 years five mutual funds all had the same mean rate of return The standard deviations for each of the five mutual funds are shown below Capital Investment 8 8 Vanity 11 1 Global Advisor 10 2 International Equities 9 3 Nomad 6 4 Which mutual fund was least consistent in rate of return This is a reading assessment question Be certain of your answer because you only get one attempt on this question Choose the correct answer below OA Global Advisor O B Capital Investment OC Nomad OD International Equities O E Vanity

Statistics
StatisticsTrue or False When comparing two populations the larger the standard deviation the more dispersion the distribution has provided that the variable of interest from the two populations has the same unit of measure Choose the correct answer below C O A True because the standard deviation describes how far on average each observation is from the typical value A larger standard deviation means that observations are more distant from the typical value and therefore more dispersed OB False because the standard deviation measures the spread of the distribution not the dispersion of the distribution OC False because the larger the standard deviation is the less dispersion the distribution has OD True because the standard deviation is the difference between the largest and smallest observation When the standard deviation is larger there is more distance between the largest and smallest observation and therefore more dispersion in the distribution

Statistics
StatisticsTrue or False Chebyshev s inequality applies to all distributions regardless of shape but the empirical rule holds only for distributions that are bell shaped Choose the correct answer below O A True Chebyshev s inequality is less precise than the empirical rule but will work for any distribution while the empirical rule only works for bell shaped distributions OB False both Chebyshev s inequality and the empirical rule will only work for bell shaped distributions OC False both Chebyshev s inequality and the empirical rule will work for any distribution O D False the empirical rule is less precise than Chebyshev s inequality but will work for any distribution while Chebyshev s inequality only works for bell shaped distributions

Statistics
StatisticsLet be the number of packages being mailed by a randomly selected customer at a certain shipping facility Suppose the distribution of X is as follows 2 3 4 p x 0 2 0 4 0 1 0 3 X X a Consider a random sample of size n 2 two customers and let X be the sample mean number of packages shipped Obtain the probability distribution of X 1 1 5 2 2 5 3 3 5 P X 0 04 1 0 6 0 16 b Refer to part a and calculate P X 2 5 0 3 0 2 0 28 0 2 2 c Again consider a random sample of size n 2 but now focus on the statistic R the sample range difference between the largest and smallest values in the sample Obtain the distribution of R Hint Calculate the value of R for each outcome and use the probabilities from part a R 0 1 3 P R 0 3 0 25 0 12 0 06 0 09 4 d If a random sample of size n 4 is selected what is P X 1 5 Hint You should not have to list all possible outcomes only those for which x 1 5

Statistics
StatisticsFind the amount necessary to fund the given withdrawals Quarterly withdrawals of 600 for 6 years interest rate is 4 7 compounded quarterly The amount necessary to fund the given withdrawals is Round to the nearest cent as needed www

Statistics
StatisticsThe annual profits of five large corporations in a certain area are given below Which measure of central tendency should be used 206 000 214 000 234 000 204 000 1 284 000 OA mean B midrange C median OD mode

Statistics
StatisticsK The table below shows a random sample of 30 quantitative SAT scores of first year students admitted at a university Make an appropriate graph of distribution of the data and describe the distribution 655 559 734 653 651 541 672 666 688 641 577 732 679 616 557 535 665 727 669 610 530 708 732 793 0 688 676 624 600 652 723 C The distribution appears to be left skewed D The distribution cannot be determined Identify any outlier s Select the correct answer below and if necessary fill in any answer box to complete your choice OA There is more than one outlier They are scores of Use a comma to separate answers as needed OB There is one outlier It is a score of OC There are no outliers in the data set

Statistics
StatisticsProvide an appropriate response In interpreting a boxplot of a data set we note that the median is to the left of the center of the box and the right line is longer than the left line We can conclude that OA The data is skewed right B The data is skewed left C The data is symmetric D Skewner mot

Statistics
StatisticsConstruct a frequency distribution for the data using five classes Describe the shape of the distribution The data set Pick Three Lottery Outcomes for 10 Consecutive Weeks 3 676061784 1 5 7 5 9 1 5399 2230884024 OA bell shaped B uniform C skewed to the left D skewed to the right

Statistics
StatisticsF According to an organization there are five leading causes of preventable death in a region They are shown in the graph to the right where HBP is High Blood Pressure TU is Tobacco Use HBG is High Blood Glucose PA is Physical Activity and OO and Overweight and Obesity Use the graph to complete parts a through e a Estimate how many preventable deaths result from high blood pressure Approximately million preventable deaths in one year result from high blood pressure Round to one decimal place as needed Millions in One Year PIN WAGON HBP TU HB

Statistics
StatisticsSAS was used to compare the high school dropout rates for the 30 school districts in one city in 2010 and 2012 The box plots generated for these dropout rates are shown below Compare the center of the distributions and the variation of the distributions for the two years 49 25 36 9375 24 625 12 3125 0 Variable RATE n

Statistics
StatisticsThe bar graph below shows the political party affiliation of 1000 registered U S voters What percentage of the 1000 registered U S voters belonged to one of the traditional two parties Democratic and Republican Percentage 40 30 20 10 0 Democrat Republican Independent Other Party Affiliation OA 40

Statistics
StatisticsA farmer wishes to test the effects of a new fertilizer on her corn yield She has four equal sized plots of land one with sandy soil one with rocky soil one with clay rich soil and one with average soil She divides each of the four plots into three equal sized portions and randomly labels them A B and C The four A portions of land are treated with her old fertilizer The four B portions are treated with the new fertilizer and the four C s are treated with no fertilizer At harvest time the corn yield is recorded for each section of land What is the response variable in this experiment OA the four types of soil B the type of fertilizer old new or none OC the section of land A B or C D the corn vield recorded for each section of land

Statistics
StatisticsExplain what is misleading about the graphic The volume of our sales has doubled OA The length of a side has doubled but the area has been multiplied by 4 B The graphic is not misleading C The length of a side has doubled but the area has been unchanged D The length of a side has doubled but the area has been multiplied by 8

Statistics
StatisticsProvide an appropriate response Given the following five number summary find Q3 2 9 5 7 10 0 13 2 21 1 OA 21 1 OB 13 2 C 10 0 D 57