Statistics Questions and Answers

Statistics
Statistics4 The chirping rate of crickets depends on the temperature and the relationship is approximately linear Suppose a cricket chirps at a rate of 110 chirps per minutes when the temperature is 70 and it chirps at a rate of 90 chirps per minute when the temperature is 60 Use the variable N to represent the number of chirps per minute and use the variable T to represent the temperature Write a linear equation that models the chirping rate N as a function of the temperature T 10 points

Statistics
Statisticsof 2011 Facebook had many millions of users in the United States The table show the number of users in each ments ar graph is the frequency distribution of the data ts S Ages 13 24 25 44 45 64 Users millions 65 53 28 146 b How many total users in millions did Facebook have in the US in 2011 c What proportion of these users were ages 13 24 Round to 2 decimal places d What proportion were ages 25 44 Round to 2 decimal places e What proportion were ages 45 64 Round to 2 decimal places f Which bar graph is the relative frequency distribution

Statistics
StatisticsAges 15 18 19 22 23 26 27 30 31 34 35 38 Number of students 8 87 7 10 10 2 2 Based on the frequency distribution above find the relative frequency for the class with lower class lim Relative Frequency Give your answer as a percent rounded to one decimal place

Statistics
StatisticsClass A 29 32 35 35 42 42 46 47 50 50 51 53 55 62 63 65 65 70 75 79 83 89 Class B 55 40 67 89 91 35 10 77 45 58 70 79 90 60 57 65 68 78 79 100 85 a The Class A data is already ordered Order the Class B data b Is this data circle one Explain why Class A Range Explain why c For each class distribution determine the values below You do not need to show steps Q1 10 Q2 Q3 IQR d For Class A draw the boxplot using the scale 20 categorical quantitative neither 30 discrete continuous neither 40 50 60 Class B Range 70 01 Q2 Q3 IQR 80 90 100

Statistics
StatisticsUse the box and whisker plot to identify the five number summary Min 10 Q Q Q3 Max 10 10 11 12 13 15 14 16 18 20

Statistics
StatisticsThe five number summary of a dataset was found to be 7 6 11 15 33 a What is the IQR b Find the lower limit ie an observation is considered an outlier if it is below this c Find the upper limit ie an observation is considered an outlier if it is above this I d Do we have any outliers O yes Ono

Statistics
StatisticsCalculate the 50th percentile of the data shown X 1 2 3 6 5 4 9 2 11 2 14 9 18 1

Statistics
StatisticsFind the 25th 50th and 75th percentile from the following list of 40 data Please enter exact answers 12 12 9 13 2 13 7 13 9 14 8 18 5 21 21 3 22 22 6 23 5 23 9 24 3 24 9 25 4 25 6 26 1 27 5 27 8 28 3 31 2 32 4 32 5 32 6 33 7 34 7 35 5 36 2 37 9 38 4 41 1 43 7 44 45 46 46 3 47 9 48 3 49 2 25th percentile 50th percentile 75th percentile

Statistics
StatisticsMany firms use on the job training to teach their employees computer programming Suppose you work in the personnel department of a firm that just finished training a group of its employees to program and you have been requested to review the performance of one of the trainees on the final test that was given to all trainees The mea and standard deviation of the test scores are 71 and 2 respectively and the distribution of scores is bell shaped ar symmetric Suppose the trainee in question received a score of 68 Compute the trainee s z score OA Z 1 50 OB z 1 5 OC z 0 93 D z 0 93
Statistics
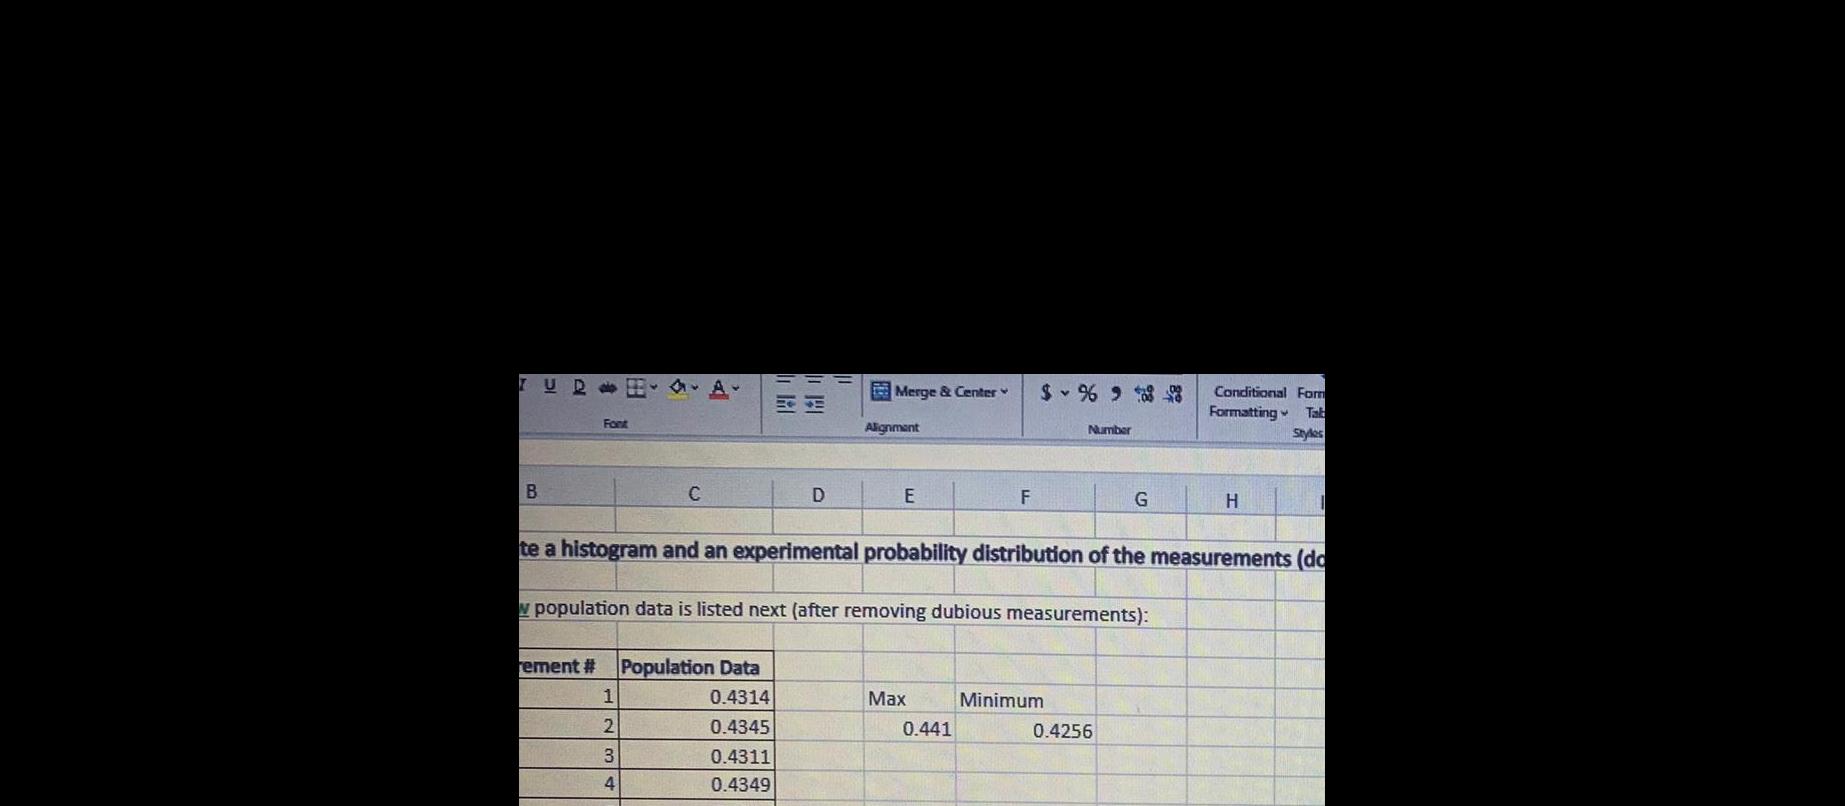
StatisticsTUD ap B Font A A C 1 2 3 4 rement Population Data 0 4314 0 4345 0 4311 0 4349 MH D Merge Center Alignment E Max F 0 441 69 88 Number te a histogram and an experimental probability distribution of the measurements do w population data is listed next after removing dubious measurements Minimum G 0 4256 Conditional For Formatting Tak Styles H 1

Statistics
Statistics13 Suppose the equation y 52 represents the exam score y earned by a student who got the night before the exam 2 points each What is the slope of the equation Interpret its meaning in context of the situation Write your answer in a comple sentence x 5x45260 52 5 X SX 3 a b What is the y intercept Interpret its meaning Write your answer in a complete sentence 52 2 Y 5X 52 60 40x 52 60 52 52 4011 5 c Predict the score of a student that slept 8 hours 3 eaned by a Stundent in X hours Y 5681452 40 52 92 it interpet in Y S d How many hours would a student need to sleep to scor on the exam 5x 52 100 solle 5 92 452 512 a

Statistics
Statisticsthe given corporate bond whose annual simple interest rate is provided find the yment and the total interest earned over the life of the bond Assume 365 days in a 700 Company A 5 year bond 0 906 e semiannual interest on the corporate bond is ound to the nearest cent as needed www

Statistics
StatisticsMatch the name of the sampling method descriptions given Situations dividing the population by Gender and choosing 30 people of each gender dividing by population by voting precinct and sampling everyone in the precints selected asking people on the street number every name on a list and use a random number generator to select the first 50 numbers surveying every 3rd driver coming through a tollbooth BO Sampling Method a Convenience b Stratified c Cluster d Simple Random e Systematic

Statistics
StatisticsA large fast food restaurant is having a promotional game where game pieces can be found on various products Customers can win food or cash prizes According to the company the probability of winning a prize large or small with any eligible purchase is 0 12 Consider your next 31 purchases that produce a game piece a Define the distribution of the number of winning prize pieces in those purchases with its name and parameters X Use GeoGebra to calculate the following Round your answers to 4 decimal places b What is the probability that you win 3 prizes c What is the probability that you win between 2 and 5 inclusive prizes d What is the probability that you win 1 prizes or fewer

Statistics
StatisticsGo 1 W For each variable decide if it is categorical or numerical a Time to mow the lawn O Categorical O Numerical b Number of homework assignments completed O Categorical O Numerical c Credit Card Number O Categorical O Numerical d Amount of candy handed out on Halloween O Numerical O Categorical e Hair color O Numerical O Categorical Question Help Message instructor

Statistics
StatisticsAbout 2 of the population has a particular genetic marker 30 people are randomly selected Use GeoGebra Classic or the formulas to find the mean and standard deviation with units for the number of people with the genetic marker in groups of 30 Type the number in the first box and the units in the second box a The mean rounded to one decimal place is b The standard deviation rounded to 2 decimal places is units units

Statistics
StatisticsUse this table from a survey to answer the following questions Round your answers to 4 decimal places of Children Born in the U S Born outside the U S Total 0 1 2 8 19 3 20 2 12 23 10 31 3 or more 9 11 20 Total 39 45 84 If one of the survey respondents is chosen at random a What is the probability that they have 2 or more children b What is the probability that they were born outside the U S and have one child c What is the probaility that they were born in the U S or have 0 children d Given that a person was born outside the U S What is the probability that they have 3 or more children e According to this dataset is the number of children a person has independent from whether or not they were born in the U S You can use either the and test or the conditional test Show a valid probability statement for your test the results and explain your conclusion Give your answer and explanation in this box or on your paper

Statistics
Statisticsthere have been nine justices at any one time on the Supreme Court of the United States one chief justice and eight associate justices Prior to that time the number of justices varied from six to ten From the court s inception in 1789 to the present day 17 men have served as chief justice of the Supreme Court including Justice Roberts The previous 16 chief justices are listed in the table below along with the length of their tenure in days This data was retrieved from the Web site of the Supreme Court www supremecourtus gov chief justice John Jay John Rutledge Oliver Ellsworth John Marshall Roger B Taney Salmon P Chase Morrison R Waite Melville W Fuller Edward D White William Howard Taft Charles E Hughes Harlan F Stone Frederick M Vinson Earl Warren Warren E Burger William H Rehnquist a Make and label a histogram and boxplot for this data using GeoGebra Insert your histogram and boxplot in the add work box and type your titles and labels above and below the graphs Use the Export button in GeoGebra and the Insert Image button in the Add work box b median tenure 2079 125 1742 12542 10425 3065 5133 7938 3804 3129 4144 1754 2633 5740 Use GeoGebra to compute each of the following summary statistics rounding to one decimal place if needed c IQR d mean 6304 6917 days days days e sample standard deviation days f Write a paragraph describing the shape center spread and unusual featuers of the data Be sure to include all 4 items with context and units in your paragraph You can type it in the box or write it on your paper

Statistics
StatisticsDetermine what the key terms refer to in the followin To determine the average number of classes Oxnard C College students were given and answered the follow How many classes you are taking this semester Parameter Statistic Population

Statistics
StatisticsK Mic m Ed Go Chi W W a Determine the shape of the distribution pictured below a 30 25 20 15 10 5 Frequency 0 5 1 5 2 5 3 5 4 5 5 5 6 5 7 5 data a

Statistics
Statistics7 What percentage of men have a height between 70 inshes and 78 inches 8 The average height of adult American men is 69 inches What percent of the adult men in the Dinaric Alps are taller than the average American man 9 What would be the minimum height of man in the Dinaric Alps that would place him in the top 10 of all heights

Statistics
StatisticsThe length of pregnancy for the Asian elephant has an approximately normal distribution with an average length of 609 days and standard deviation of 31 days 10 How long do the longest 5 of all elephant pregnancies last 11 What percent of the elephant pregnancies last between 600 and 615 days 12 The shortest 20 of all elephant pregnancies last fewer than how many days 13 The middle 50 of all elephant pregnancies fall between how many days

Statistics
Statisticscom Student PlayerHomework aspx homew SP1 2023 nt 5 Hypothesis Testing One You are the manager of a restaurant for a f places an order until the time the customer minute Complete parts a and b below

Statistics
Statisticss Statistics SP1 2023 Demo 2 Lesson 5 K The data table below contains the amounts that a sample of nine Click here to view page 1 of the table of critical values of t Click here to view page 2 of the table of critical values of t 4 14 5 09 5 77 6 42 7 37 7 44 8 45 8 45 9 83 D a At the 0 10 level of significance is there evidence that the r State the null and alternative hypotheses Ho H 6 5 6 5


Statistics
Statisticson com Student Playe SP1 2023 ent 5 Hypothesis Testing One K Recently a large academic medical center determine level of significance is there evidence that the propor What are the correct hypotheses to test to determine A Ho 0 48 H 0 48 OF H T 0 48 H 0 48

Statistics
StatisticsT1800 Business Statistics SP1 2023 Homework Assignment 5 Hypothesis Testing One Sample Upd stion list Question 2 Question 3 K In a one tail hypothesis test where you reject Ho Click to view the first page of the table of critical The critical value of the t test statistic is Round to four decimal places as needed

Statistics
StatisticsThe probability density function for the diameter of a drilled hole in millimetres is 10e x 5 for x 5 mm Although the target diameter is 5 millimetres vibrations tool wear and other nuisances produce diameters greater than 5 millimetres a Determine the mean and variance of the diameter of the holes b Determine the probability that a diameter exceeds 5 1 millimetres

Statistics
Statisticsformal Scores on the Wechsler Adult Intelligence Scale a standard IQ test are approximately normal for the 20 to 34 age group with p 110 and o 25 1 What percent of this age group have an IQ less than 100 normal caf 999 100 110 115 344578234 46 1 normalcaf 999 4 0 1 2 What percent of this age group have an IQ between 90 and115 HGMAI 3 Find the 80th percentile of the IQ scores distribution of 20 to 34 year olds 4 Find the IQ score which separates the lowest 25 of all IQ scores for this age group from the highest 75 160 10 20 30 40 50 60 70

Statistics
StatisticsAn annual marathon covers a route that has a distance of approximately 26 miles Winning times for this marathon are all over 2 hours The following data are the minutes over 2 hours for the winning male runners over two periods of 20 years each Earlier Period 13 7 6 10 20 23 19 13 18 15 22 18 16 10 12 14 13 10 20 16 Recent Period 78 7 9 9 8 7 9 a Make a stem and leaf display for the minutes over 2 hours of the winning times for the earlier period Use two lines per stem Use the tens digit as the stem and the ones digit as the leaf Enter NONE in any unused answer blanks For more details view How to Split a Stem Minutes Beyond 2 Hours Earlier Period 14 11 7 7 98 14 10 9 10 89 b Make a stem and leaf display for the minutes over 2 hours of the winning times for the recent period Use two lines per stem Use the tens digit as the stem and the ones digit as the leaf Enter NONE In any unused answer blanks Minutes Beyond 2 Hours Recent Period

Statistics
StatisticsThe Grand Canyon and the Colorado River are beautiful rugged and sometimes dangerous Thomas Myers is a physician at the park clinic in Grand Canyon Village Dr Myers has recorded for a 5 year period the number of visitor injuries at different landing points for commercial boat trips down the Colorado River in both the Upper and Lower Grand Canyon Source Fateful Journey by Myers Becker Stevens Upper Canyon Number of Injuries per Landing Point Between North Canyon and Phantom Ranch 2 3 1 1 3 4 693 13 Lower Canyon Number of Injuries per Landing Point Between Bright Angel and Lava Falls 8 1 1 0 6 7 2 14 3 0 1 13 2 1 a Compute the mean median and mode for injuries per landing point in the Upper Canyon Enter your answers to one decimal place mean median mode b Compute the mean median and mode for injuries per landing point in the Lower Canyon Enter your answers to one decimal place mean median mode c Compare the results of parts a and b O The Lower Canyon mean is greater while the median and mode are the same The mean median and mode are greater for the Upper Canyon O The Lower Canyon mean is greater while the median and mode are less O The mean median and mode are greater for the Lower Canyon d The Lower Canyon stretch had some extreme data values Compute a 5 trimmed mean for this region and compare this result to the mean for the Upper Canyon computed in part a Enter your answer to 2 decimal places O The trimmed mean is closer to the Upper Canyon mean

Statistics
StatisticsAre cigarettes bad for people Cigarette smoking involves tar carbon monoxide and nicotine measured in milligrams The first two are definitely not good for a person s health and t last ingredient can cause addiction 1 2 3 Brand Tar Nicotine CO Alpine 14 1 0 86 13 6 Benson Hedges 16 01 1 06 16 6 Bull Durham 29 8 2 03 23 5 8 0 0 67 10 2 0 40 5 4 1 04 15 0 4 1 Camel Lights Carlton Chesterfield Golden Lights 15 0 8 8 0 76 9 0 0 95 12 3 Kent 12 4 Kool 16 6 1 12 16 3 14 9 13 7 15 1 1 02 15 4 1 01 13 0 0 90 14 4 7 8 0 57 10 0 4 L M Lark Lights Marlboro Merit Brand MultiFilter Newport Lights Now Old Gold Pall Mall Lights Raleigh Salem Ultra Tareyton True Viceroy Rich Light Virginia Slim Winston Lights Tar Nicotine CO 11 4 0 78 10 2 9 0 0 74 9 5 1 5 1 0 0 13 1 26 18 5 1 08 12 6 0 96 17 5 4 9 17 0 12 8 15 8 4 5 14 5 7 3 8 6 15 2 12 0 Use the data in the table above to make a stem and leaf display for milligrams of tar per cigarette smoked Enter NONE in any unused answer blanks Milligrams of Tar per Cigarette 0 42 1 01 0 61 0 69 1 02 0 82 15 9 8 5 10 6 13 9 14 9

Statistics
StatisticsSeveral students are working together to estimate the true proportion of M Ms among all milk chocolate M Ms The students purchase many packs of M Ms and counted 64 red M Ms among a total of 525 M Ms The students will consider their sample to be a random sample from all plain variety M Ms a Construct and interpret a 90 confidence interval for the true proportion of red M Ms among all milk chocolate M Ms b The students claim that the true proportion of red M Ms is different from 10 Does the interval in part a suggest that this claim is plausible Explain your reasoning c One of the students admits to eating 10 M Ms before they were counted She recalls there were exactly 4 red M M among the 10 M Ms she ate Could this new information change the answer to part b Support your answer with a calculation

Statistics
StatisticsI collect a random sample of size n from a population and from the data collected compute a 95 confidence interval for the population proportion Which of the following would produce a wider confidence interval based on these same data Select one O a Use a larger confidence level O b Use a smaller confidence level O c Use the same confidence level but compute the interval n times Approximately 5 of these intervals will be wider Increase the sample size Od e Nothing can ensure that you will get a wider interval One can only say the probability of obtaining a larger interval is

Statistics
StatisticsFind the exact value of the remaining trigonometric functions of 0 24 tan0 sin0 0 7 CERF cot 0 Simplify your answer including any radicals Use integers or fractions for any numbers in the expression sin e Simplify your answer including any radicals Use integers or fractions for any numbers in the expression cos 8 Simplify your answer including any radicals Use integers or fractions for any numbers in the expression csc0 Simplify your answer including any radicals Use integers or fractions for any numbers in the expression sec 8 Simplify your answer including any radicals Use integers or fractions for any numbers in the expression

Statistics
StatisticsT g x 2 of f is shown in red and the graph of g is shown in blue ly a blue section of graph shows up that means the red nd your values to the closest integer

Statistics
StatisticsFor a 15 i e 15 Type I error compute z value for control limit formula For a 20 i e 20 Type I error compute z value for control limit formula
Statistics
StatisticsAnswer How to enter your answer opens in new window Tables Copy Data Keypa Keyboard Shortc


Statistics
StatisticsCalculate the mean for the discrete probability distribution shown here 6 25 O 25 X p x O 2 225 0 2 8 9 1 0 02 6 8 0 06 10 0 72

Statistics
StatisticsVioleta owns all nine books in the Judy Moody series In how many different orders can she place all of them on the top shelf of her bookshelf

Statistics
StatisticsLet AA be the event that a randomly selected IRSC student is an Associate of Arts student and P AA 0 39 Let the event PM be the event that a randomly selected IRSC student is on the pre med degree track and P PM 0 35 Finally the probability that a randomly selected IRSC student is an AA degree seeker and on the pre med degree track is 0 05 Use this information to calculate the following probability Round solutions to three decimal places if necessary What is the probability that a randomly selected IRSC student an AA degree seeker or on the pre med degree track P AA or PM

Statistics
Statisticsstudents There are 8000 first year students 5000 male and 3000 female is most interested in differences between male and female first about the school She gives you the assignment public university wants to determine You decide to use a sample of 800 stratified by gender Choose the way to do the sampling a Pick 400 males and 400 females at random Pick 500 males and 300 females at random Pick 300 males and 500 females at random Pick 600 males and 200 females at random b c d 2 Suppose your older sister just had her first child Her pediatrician tells her that her baby is at the third quartile for weight Which statement below is most correct about your sister s newborn 8000 fy 5000 m3 3000 F a Her baby weighs about 75 of the average weight b About 75 of all babies weigh less than your sister s baby Her baby weighs about the same as 75 of all babies d About 75 of all babies weigh more than your sister s baby c Ratio d Interval 3 Given the following salaries 40 000 142 000 144 000 145 000 147 000 149 000 150 000 Which statement below is most correct no calculations needed a The mean is the best measure for the center of these data b The median is the best measure for the center of these data c The mean and median are both equally good measures for the center of these data The mean will be above the median for these data 4 In a study of the aggressiveness of grizzly bears a sample of grizzly bears is ranked as follows 0 not aggressive at all 1 somewhat aggressive 2 highly aggressive This kind of variable would be a Qualitative b Quantitative 5 Which of the following is the least prone to being biased a Convenience sampling b Random sampling Systematic sampling d Stratified sampling

Statistics
StatisticsAdez moi sich no bend 15 Denomination Effect a Find the probability of randomly selecting a student who spent the money given that the student was given four quarters b Find the probability of randomly selecting a student who spent the money given that the student was given a 1 bill What do the preceding results suggest

Statistics
Statisticsording to police sources a car with a certain protection system will be recovered 92 of the time If 600 stolen cars ation of the number of cars recovered after being stolen Round the answers to the nearest hundredth A mean 552 00 standard deviation 44 16 B mean 552 00 standard deviation 6 65 C mean 305 00 standard deviation 6 65 D mean 305 00 standard deviation 11 16

Statistics
StatisticsBusiness Costs MC A small business owner sells personalized pens for 1 90 each The variable cost per pen is 1 10 and fixed expenses are 35 700 00 per year Determine how many pens the small business owner needs to make a yearly profit of 10 000 O 8 567 pens 15 233 pens 32 125 pens

Statistics
StatisticsFor 3 9 The mean weight of adult American men is 180 pounds with standard deviation of 25 pounds The weights are approximately normally distributed Use the 68 95 99 7 Rule to approximate each of the following 3 Using the values given above label the normal curve at the right with the numerical values for u a 20 and 30 4 What percent of all adult American men have a weight less than 130 pounds 5 What percent of all adult American men have a weight between 130 and 205 pounds 6 What percent of all adult American men have a weight less than 230 pounds 7 What percent of all adult American men have a weight less than 105 pounds 8 The heaviest 16 of all men in weight weigh more than how many pounds 9 What weight separates the lowest 2 5 of all American men in weight from the remaining weights

Statistics
StatisticsFor 26 28 Find the value of z from the standard normal distribution that satisfies each of following conditions Use the value of z from Table A that comes closest to satisfying the condition 26 Area is 0 0630 N z 27 z N Area is 0 2981 28 Z Z z Area is 0 5035

Statistics
StatisticsFor 10 17 Elephants have the longest pregnancy of all mammals One species of elephant has a mean gestation period of 525 days and standard deviation of 32 days Pregnancy length follows an approximately normally distribution Use the 68 95 99 7 Rule to approximate each of the following 10 Using the values given above label the normal curve at the right with the numerical values for o 20 and 30 11 The longest 16 of all elephant pregnancies last at least how many days 12 The middle 68 of all elephant pregnancies last between and days 13 Only 2 5 of all elephant pregnancies last longer than days 14 What percent of elephant pregnancies last less than 461 days 15 What percent of elephant pregnancies last between 525 and 557 days 16 What percent of elephant pregnancies last between 493 and 589 days 17 What percent of elephant pregnancies last less than 557 days