
A Venn Diagram is a visual representation of sets and their relationships. Whether you’re a student studying math, a business analyst evaluating data, or a programmer coding logic, understanding Venn diagrams can be useful in different fields. Let’s delve into the world of Venn diagrams, exploring their definition, symbols, types, and a step-by-step guide on how to draw one.
An Introduction to Venn Diagram
The Venn diagram, named after British mathematician John Venn, is a logical and pictorial tool used to depict relationships between different sets. The simple and effective format of Venn diagrams makes them a popular choice for visualizing data overlaps, similarities, and differences. Whether it’s in mathematics, set theory, logic, statistics, or even business analysis, Venn diagrams can provide clear and intuitive insights.
For those exploring the visual representation of set relationships through Venn diagrams and interested in diverse mathematical concepts, our hyperbolic functions and explicit formula pages serve as enriching references. These resources delve into advanced mathematical topics, providing a comprehensive exploration beyond set theory and Venn diagrams.
What is a Venn Diagram?
A Venn diagram is a graphical representation of sets, where each set is represented by a closed figure, usually a circle, inside a box that represents the universal set. The points where the circles overlap symbolize the intersection of the sets, indicating common elements between them. If the circles do not overlap, it signifies that the sets do not share common elements.
Venn Diagram Symbols
To understand and construct a Venn diagram, you need to familiarize yourself with the key symbols used in set theory. Here are some of the essential symbols:
| Venn Diagram Symbols | Name of the Symbol | Explanation |
|---|---|---|
| ∪ | Union Symbol | Denotes the union of two sets. It includes elements that belong to either set or both. |
| ∩ | Intersection Symbol | Represents the intersection of two sets. It includes elements that belong to both sets. |
| A’ or Ac | Complement Symbol | Denotes the complement of a set. It includes elements that are not part of the set. |
Terms Related to Venn Diagram
To fully grasp Venn diagrams, it’s crucial to understand the following terms:
Universal Set
A universal set, typically denoted by U or sometimes E, is a set that contains all the elements under consideration. In a Venn diagram, the universal set is represented by a rectangle, with all other sets represented by circles or closed figures within this rectangle.
Subset
A subset is a set whose elements are entirely contained within another set. For instance, if every element of Set A is also an element of Set B, then Set A is a subset of Set B, denoted as A ⊆ B. Every set is considered a subset of itself.
Venn Diagram for Sets Operations
Venn diagrams can be used to depict various operations performed on sets, such as the union, intersection, complement, and difference. Let’s look at each of these operations:
Union of Sets Venn Diagram
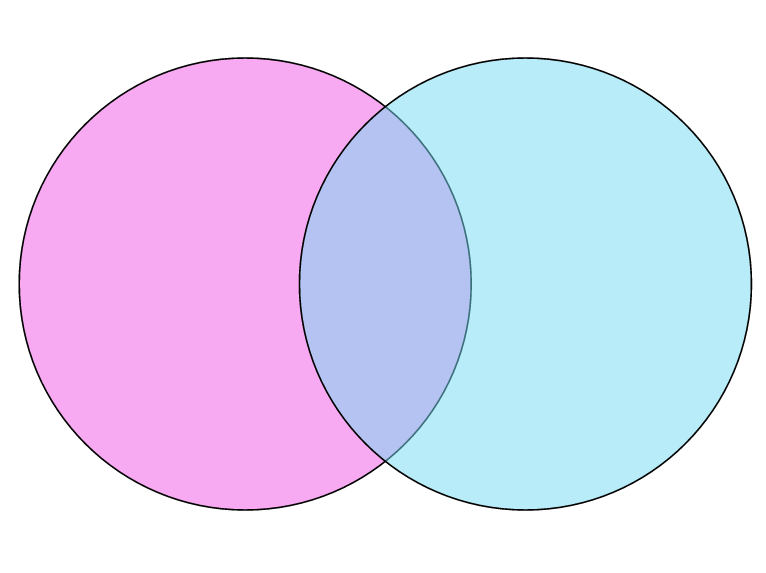
The union of two sets, denoted by A ∪ B, includes all the elements present in either Set A, Set B, or both. In a Venn diagram, the combined area of two circles represents the union of the sets.
Intersection of Sets Venn Diagram
The intersection of two sets, denoted by A ∩ B, includes all the common elements in both sets. In a Venn diagram, the overlapping region of two circles denotes the intersection of the sets.
Complement of Set Venn Diagram
The complement of a set, denoted by A’ or Ac, includes all the elements that are not part of the set. In a Venn diagram, the area outside a circle but within the rectangle represents the complement of the set.
Difference of Set Venn Diagram
The difference of sets, denoted by A – B, includes all elements of Set A that are not part of Set B. In a Venn diagram, the part of the circle representing Set A that does not overlap with Set B signifies the difference of the sets.
Types of Venn Diagrams
The complexity and number of circles in a Venn diagram can vary according to the number of sets being compared. Here are the primary types of Venn diagrams:
Two-set Venn diagram
This is the simplest form of a Venn diagram involving two circles representing two different sets. Their intersection signifies the common elements of the two sets.
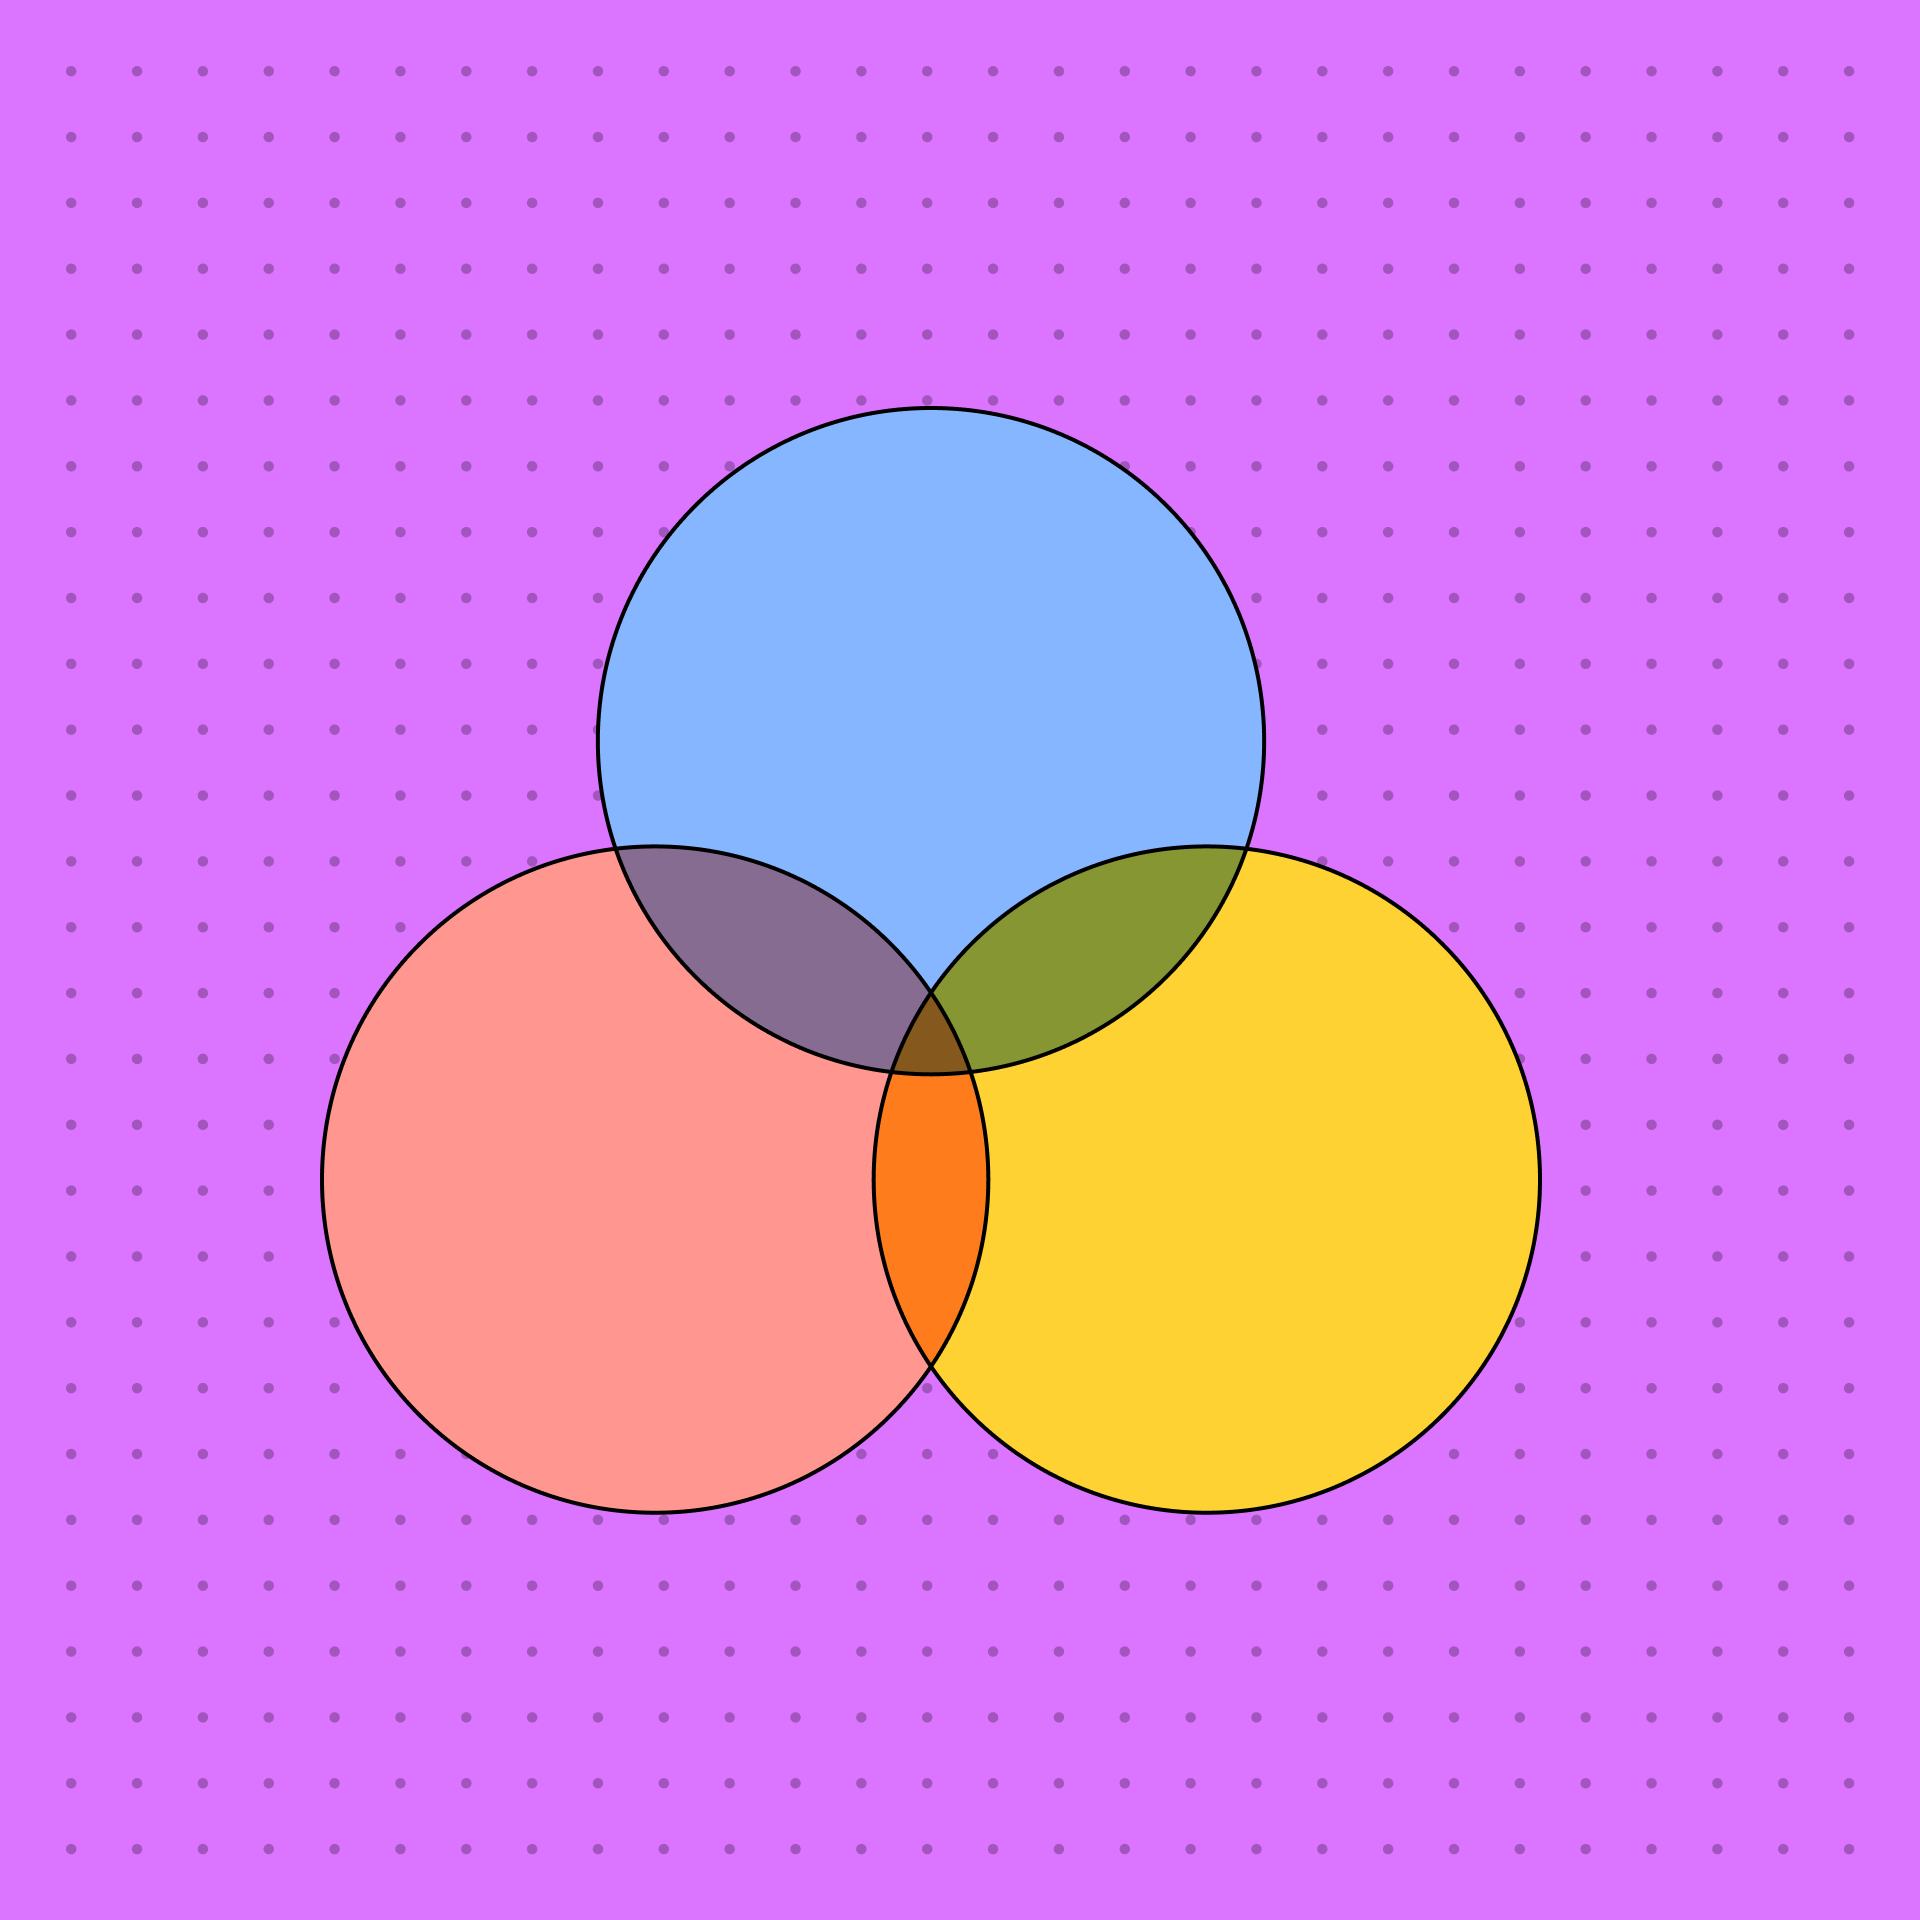
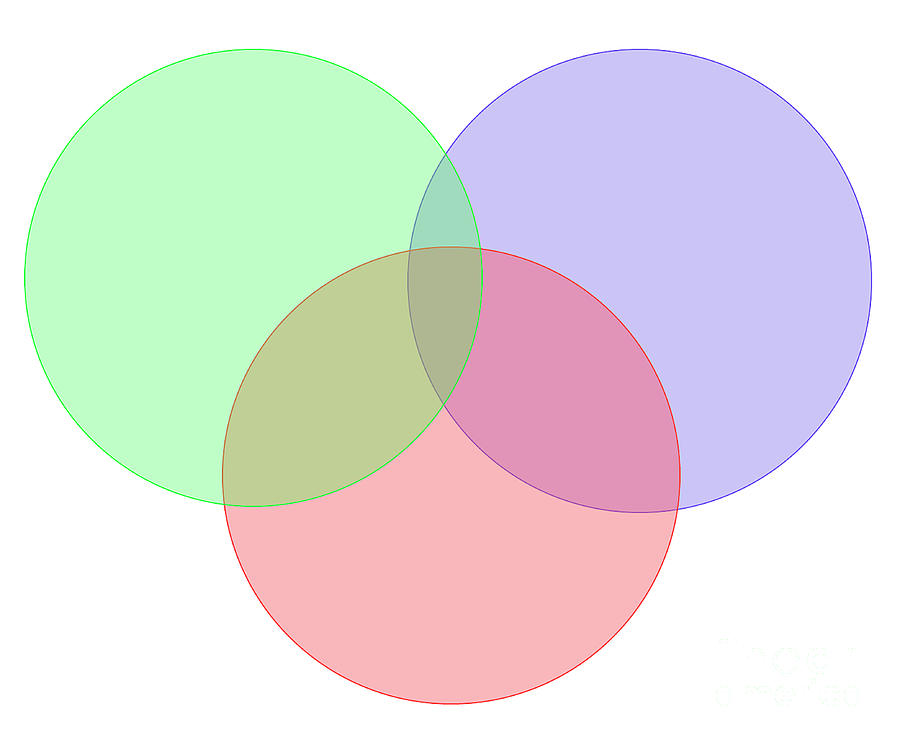
Three-set Venn diagram
This diagram involves three overlapping circles, each representing a distinct set. It can depict common elements among the three sets, unique elements, and elements common to only two sets.
Four-set Venn diagram
This diagram includes four overlapping circles, each representing a different set. It can show common and unique elements among the four sets, and elements common to only some sets.
Five-set Venn diagram
This complex diagram includes five overlapping circles, each representing a different set. It can show common and unique elements among the five sets, and elements common to only some sets.

Venn Diagram for Three Sets
Drawing a Venn diagram for three sets involves three intersecting circles. Each circle represents a set, and their overlapping areas depict common elements. The section where all three circles intersect represents elements common to all three sets.
How to Draw a Venn Diagram?
Drawing a Venn diagram involves a few simple steps:
- Organize the data: Categorize all the items into sets.
- Draw a rectangle: Draw a rectangle and label it. This rectangle represents the universal set.
- Draw circles: Sketch circles according to the number of categories you have. Make sure the circles overlap if there are common elements between the sets.
- Place items in circles: Arrange all items in the relevant circles as per the guidelines.
Venn Diagram Formula
In set theory, the Venn diagram formula is used to find the number of elements in the union of two sets when the number of elements in each set and their intersection is known. The formula is:
n(A ∪ B) = n(A) + n(B) – n (A ∩ B)
This formula can be extended to three sets:
n (A ∪ B ∪ C) = n(A) + n(B) + n(C) – n(A ∩ B) – n(B ∩ C) – n(C ∩ A) + n(A ∩ B ∩ C)
Applications of Venn Diagram
Venn diagrams are widely used across several fields for their ability to visually represent complex data. Some of the applications of Venn diagrams are:
- They are used to show the classification of data belonging to the same category but different sub-categories.
- Venn diagrams allow comparison of two or more subjects, highlighting their similarities and differences.
- They are used to reason through the logic behind statements or equations.
- In mathematics, Venn diagrams are used in Set Operations, Data Interpretation, Percentages and reasoning topics like Syllogisms.
- They are used in business and industries to compare and distinguish outcomes, services, operations, and so on.
Solved Examples on Venn Diagram
Let’s solve a few examples using Venn diagrams to understand their application better.
Example 1: In a class of 30 students, 10 study English and 20 study Mathematics. Find the number of students who study both subjects.
Solution: In a Venn diagram, let the circle representing English be A, and the circle representing Mathematics be B. The overlapping region represents the students who study both subjects.
Example 2: In a survey of 100 people, 60 like coffee, 40 like tea, and 20 like both coffee and tea. How many people like neither coffee nor tea?
Solution: In a Venn diagram, let the circle representing coffee be A, and the circle representing tea be B. The region outside the circles represents the people who like neither coffee nor tea.
How Kunduz Can Help You Learn Venn Diagrams?
Learning about Venn diagrams can be a bit confusing, especially when you’re dealing with multiple sets. The interactive platform Kunduz offers detailed explanations and solutions for Venn diagram problems. With Kunduz, you can get step-by-step solutions from experts, making the learning process more engaging and effective. So, take advantage of Kunduz and master the concept of Venn diagrams!