Question:
1 Figure shows the variation in temperature AT with the
Last updated: 6/9/2023
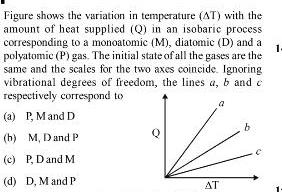
1 Figure shows the variation in temperature AT with the amount of heat supplied Q in an isobaric process corresponding to a monoatomic M diatomic D and a polyatomic P gas The initial state of all the gases are the same and the scales for the two axes coincide Ignoring vibrational degrees of freedom the lines a b and c respectively correspond to a P M and D b M D and P c P D and M d D M and P AT b