Question:
10 Connect features of a polynomial graph with a real world
Last updated: 2/25/2023
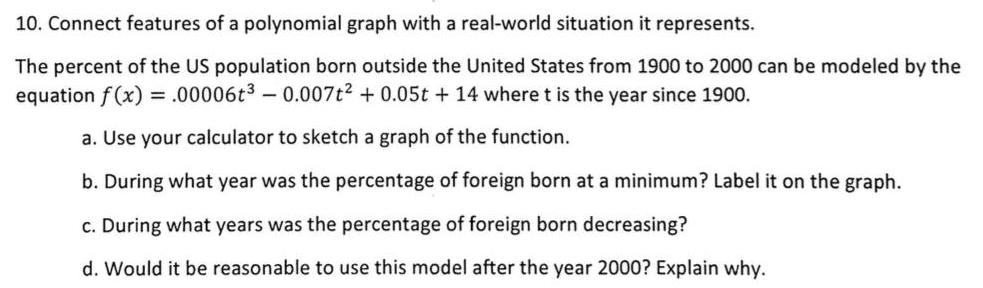
10 Connect features of a polynomial graph with a real world situation it represents The percent of the US population born outside the United States from 1900 to 2000 can be modeled by the equation f x 00006t 0 007t 0 05t 14 where t is the year since 1900 a Use your calculator to sketch a graph of the function b During what year was the percentage of foreign born at a minimum Label it on the graph c During what years was the percentage of foreign born decreasing d Would it be reasonable to use this model after the year 2000 Explain why