Question:
3 The table shows pork production in China from 2000 to 2007
Last updated: 8/9/2023
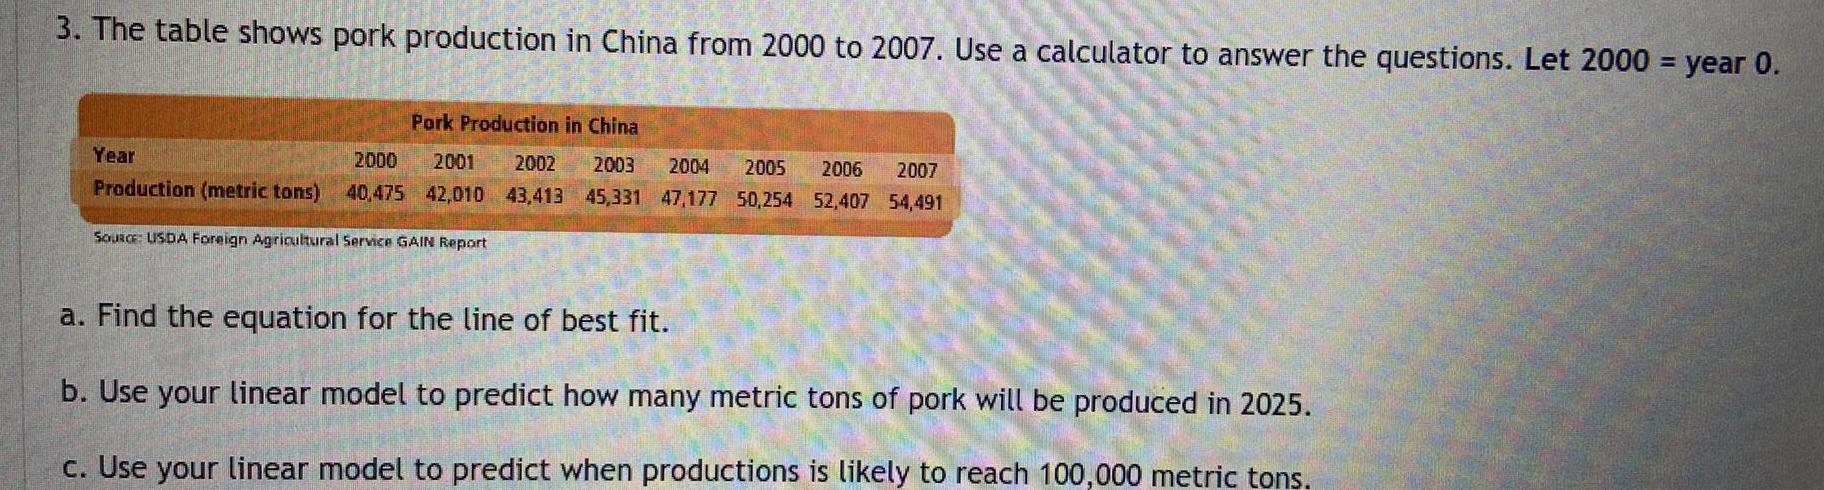
3 The table shows pork production in China from 2000 to 2007 Use a calculator to answer the questions Let 2000 year 0 Pork Production in China Year 2000 2001 2002 2003 2004 2005 2006 2007 Production metric tons 40 475 42 010 43 413 45 331 47 177 50 254 52 407 54 491 SOURCE USDA Foreign Agricultural Service GAIN Report a Find the equation for the line of best fit b Use your linear model to predict how many metric tons of pork will be produced in 2025 c Use your linear model to predict when productions is likely to reach 100 000 metric tons