Question:
4 This graph shows the downward trend of sea ice over 32
Last updated: 4/10/2023
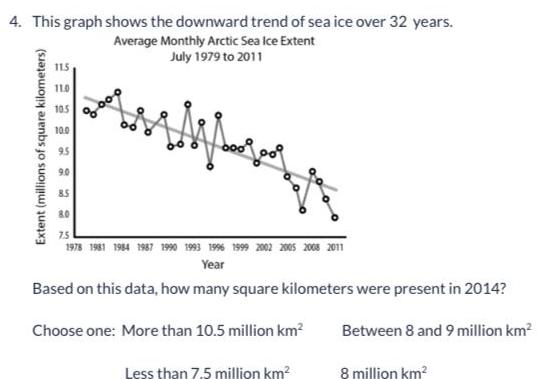
4 This graph shows the downward trend of sea ice over 32 years Average Monthly Arctic Sea Ice Extent July 1979 to 2011 Extent millions of square kilometers 11 5 11 0 105 0 10 0 9 5 9 0 8 5 8 0 7 5 1978 1981 1984 1987 1990 1993 1996 1999 2002 2005 2008 2011 Year Based on this data how many square kilometers were present in 2014 Between 8 and 9 million km Choose one More than 10 5 million km Less than 7 5 million km 8 million km