Question:
7 Graph between power time is given below Then which of the
Last updated: 6/7/2023
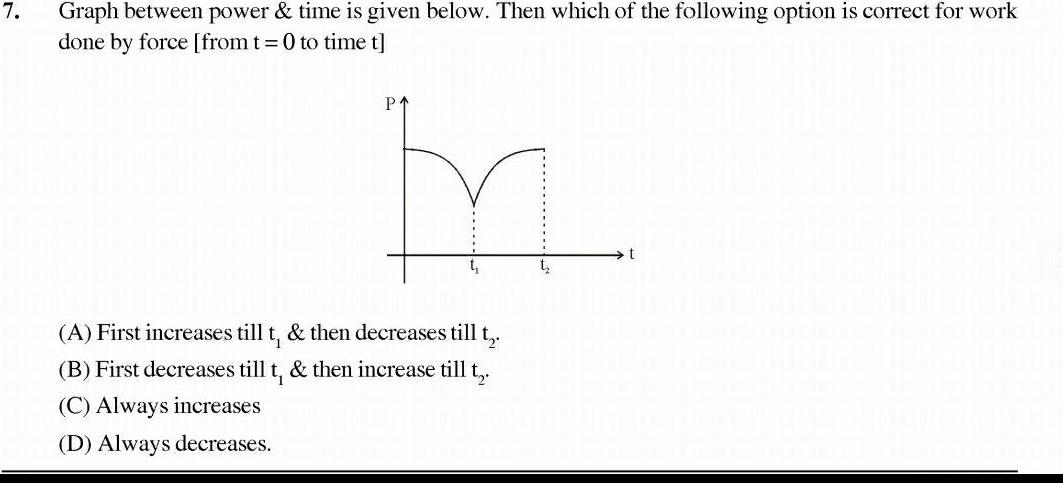
7 Graph between power time is given below Then which of the following option is correct for work done by force from t 0 to time t P A First increases till t then decreases till t B First decreases till t then increase till t C Always increases D Always decreases t t