A university conducted a survey of 364 undergraduate
Last updated: 6/29/2023
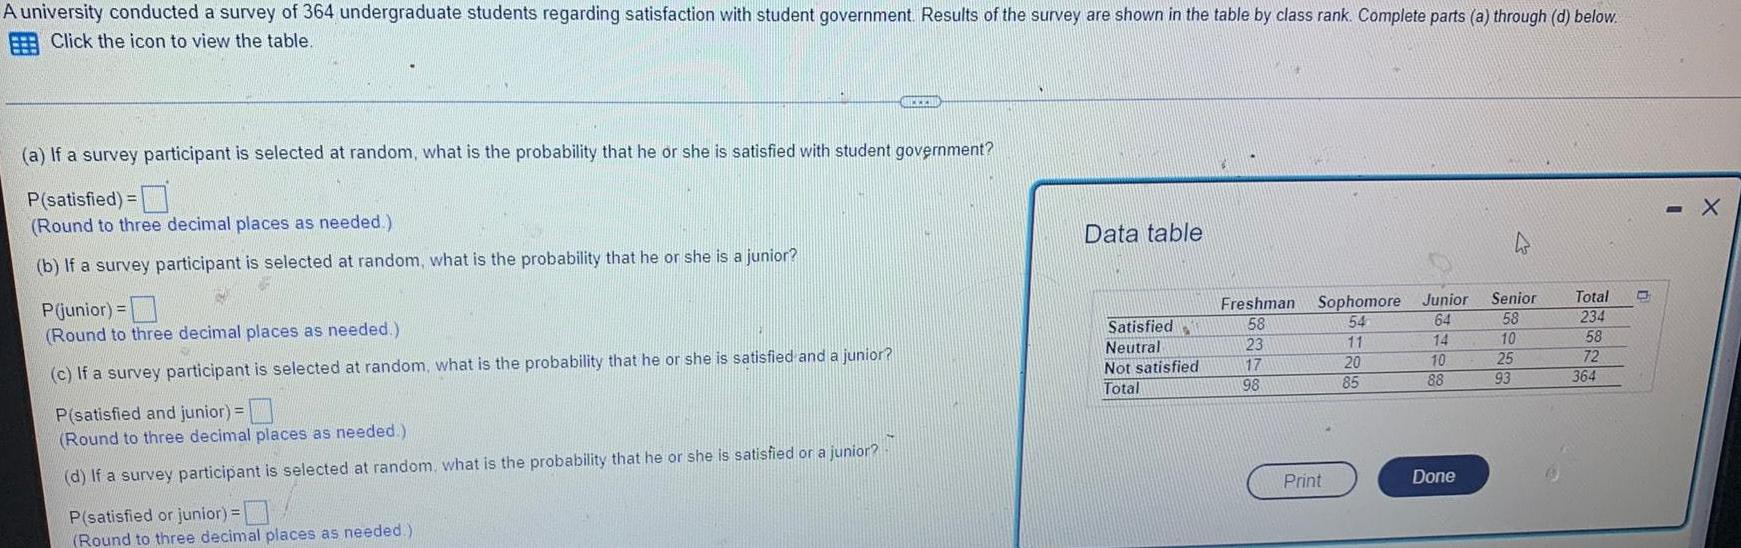
A university conducted a survey of 364 undergraduate students regarding satisfaction with student government Results of the survey are shown in the table by class rank Complete parts a through d below Click the icon to view the table a If a survey participant is selected at random what is the probability that he or she is satisfied with student government P satisfied Round to three decimal places as needed b If a survey participant is selected at random what is the probability that he or she is a junior P junior Round to three decimal places as needed c If a survey participant is selected at random what is the probability that he or she is satisfied and a junior P satisfied and junior Round to three decimal places as needed d If a survey participant is selected at random what is the probability that he or she is satisfied or a junior GELED P satisfied or junior Round to three decimal places as needed Data table Satisfied Neutral Not satisfied Total Freshman 58 23 17 98 Sophomore Junior 64 54 11 14 10 88 Print 20 85 Done Senior 58 10 25 93 Total 234 58 72 364 C X