Question:
Annual sales for a company were collected over a period of
Last updated: 6/12/2023
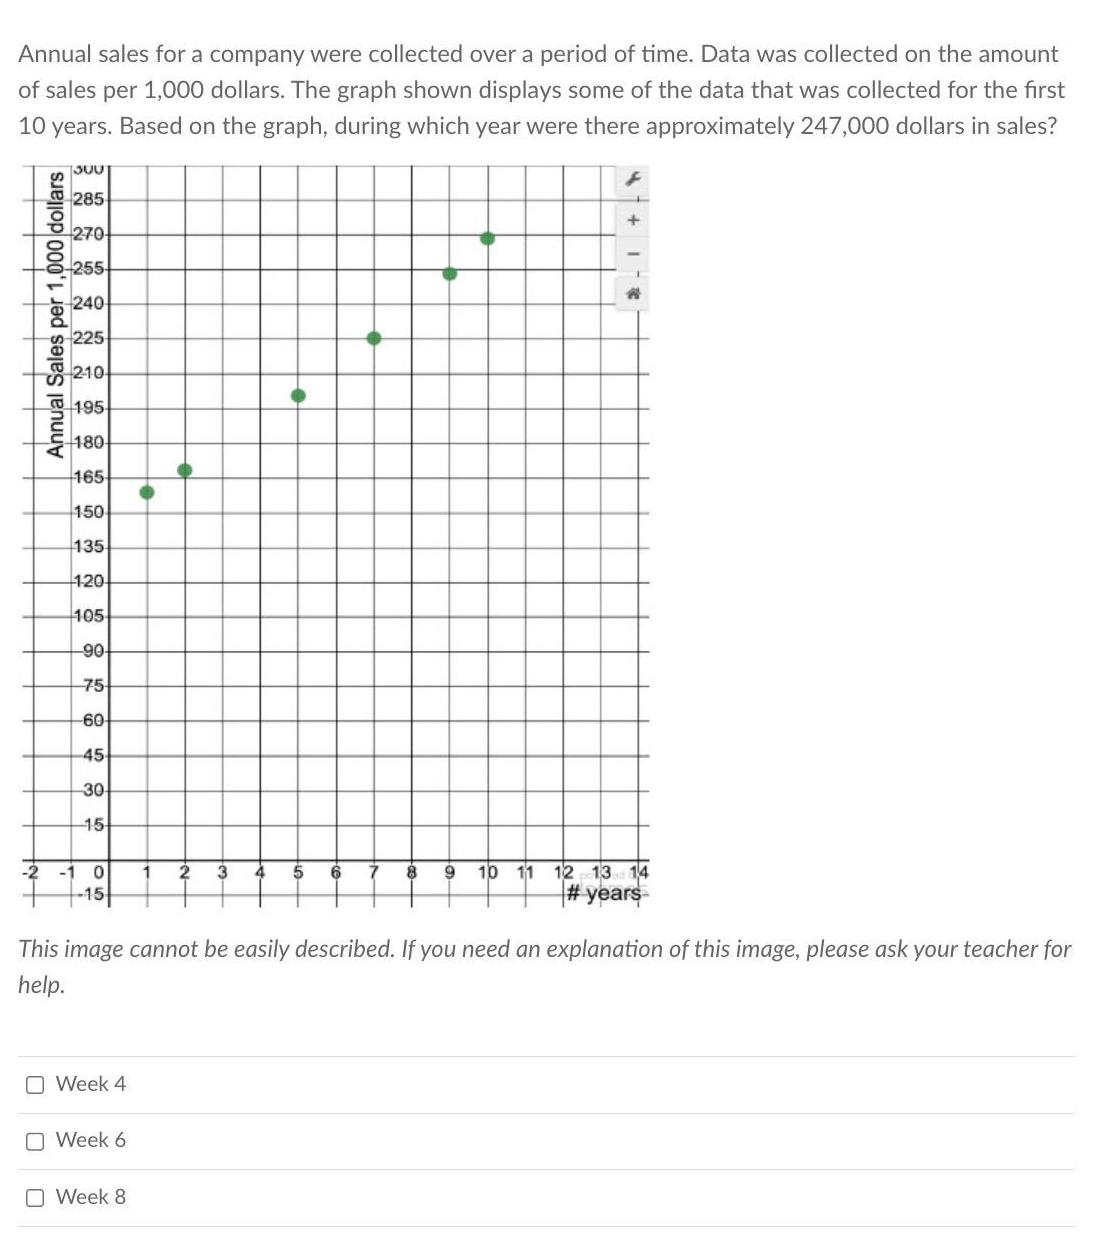
Annual sales for a company were collected over a period of time Data was collected on the amount of sales per 1 000 dollars The graph shown displays some of the data that was collected for the first 10 years Based on the graph during which year were there approximately 247 000 dollars in sales 13001 285 270 255 Annual Sales per 1 000 dollars 240 225 210 195 180 165 150 135 120 105 90 75 60 45 30 15 2 1 0 15 Week 4 Week 6 1 Week 8 2 3 4 5 6 7 f T This image cannot be easily described If you need an explanation of this image please ask your teacher for help A 8 9 10 11 12 13 14 years