e accompanying bar graph shows the resident population and
Last updated: 3/6/2023
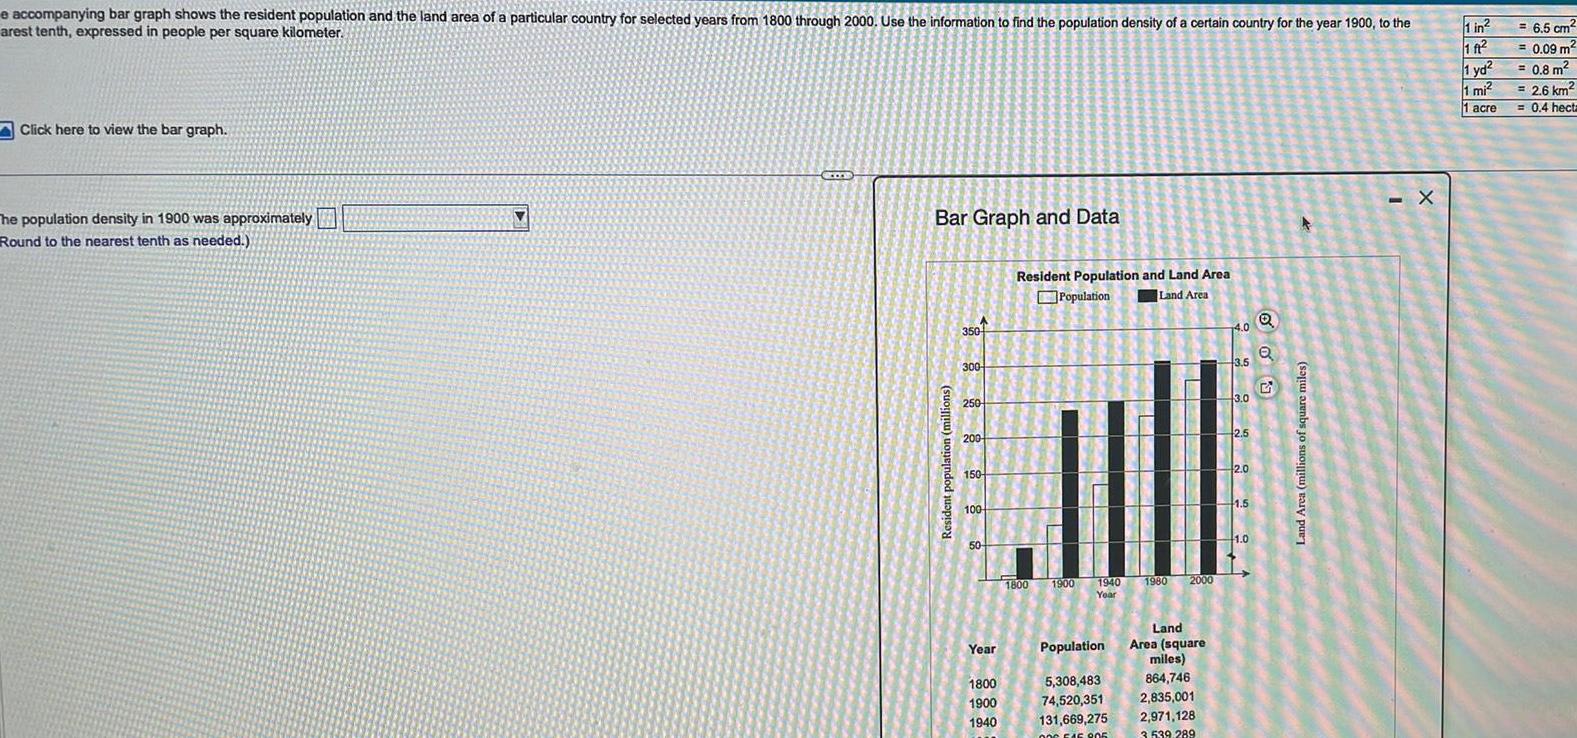
e accompanying bar graph shows the resident population and the land area of a particular country for selected years from 1800 through 2000 Use the information to find the population density of a certain country for the year 1900 to the arest tenth expressed in people per square kilometer Click here to view the bar graph The population density in 1900 was approximately Round to the nearest tenth as needed BE Bar Graph and Data Resident population millions 350 300 250 200 150 100 50 Year Resident Population and Land Area Population Land Area Jill 1980 1900 1940 Year 1800 1900 1940 1800 Population 5 308 483 74 520 351 131 669 275 000 546 805 2000 Land Area square miles 864 746 2 835 001 2 971 128 3 539 289 4 0 3 5 3 0 2 5 2 0 1 5 1 0 Q A X 1 in 6 5 cm 1 ft 0 09 m 1 yd 0 8 m 1 mi 2 6 km 1 acre 0 4 hect