Question:
e graph shows the projections in total enrollment at degree
Last updated: 2/14/2023
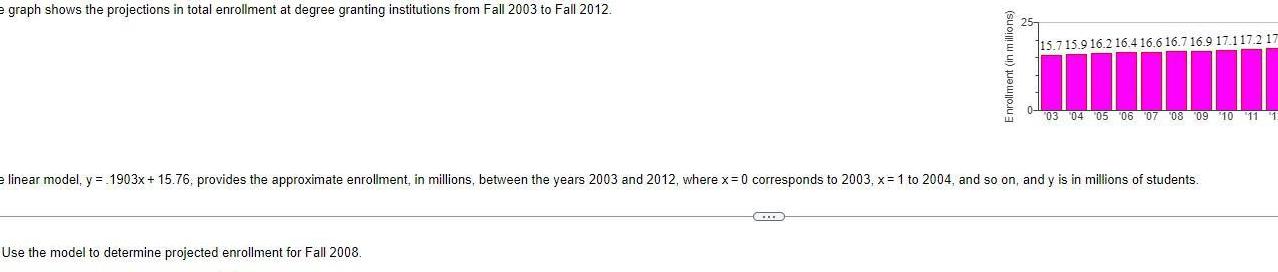
e graph shows the projections in total enrollment at degree granting institutions from Fall 2003 to Fall 2012 Enrollment in millions Use the model to determine projected enrollment for Fall 2008 15 715 9 16 2 16 4 16 616 7 16 9 17 117 2 17 03 04 05 06 07 08 09 10 11 e linear model y 1903x 15 76 provides the approximate enrollment in millions between the years 2003 and 2012 where x 0 corresponds to 2003 x 1 to 2004 and so on and y is in millions of students