erg law is a logical consequence of Mendel s first law of
Last updated: 1/14/2024
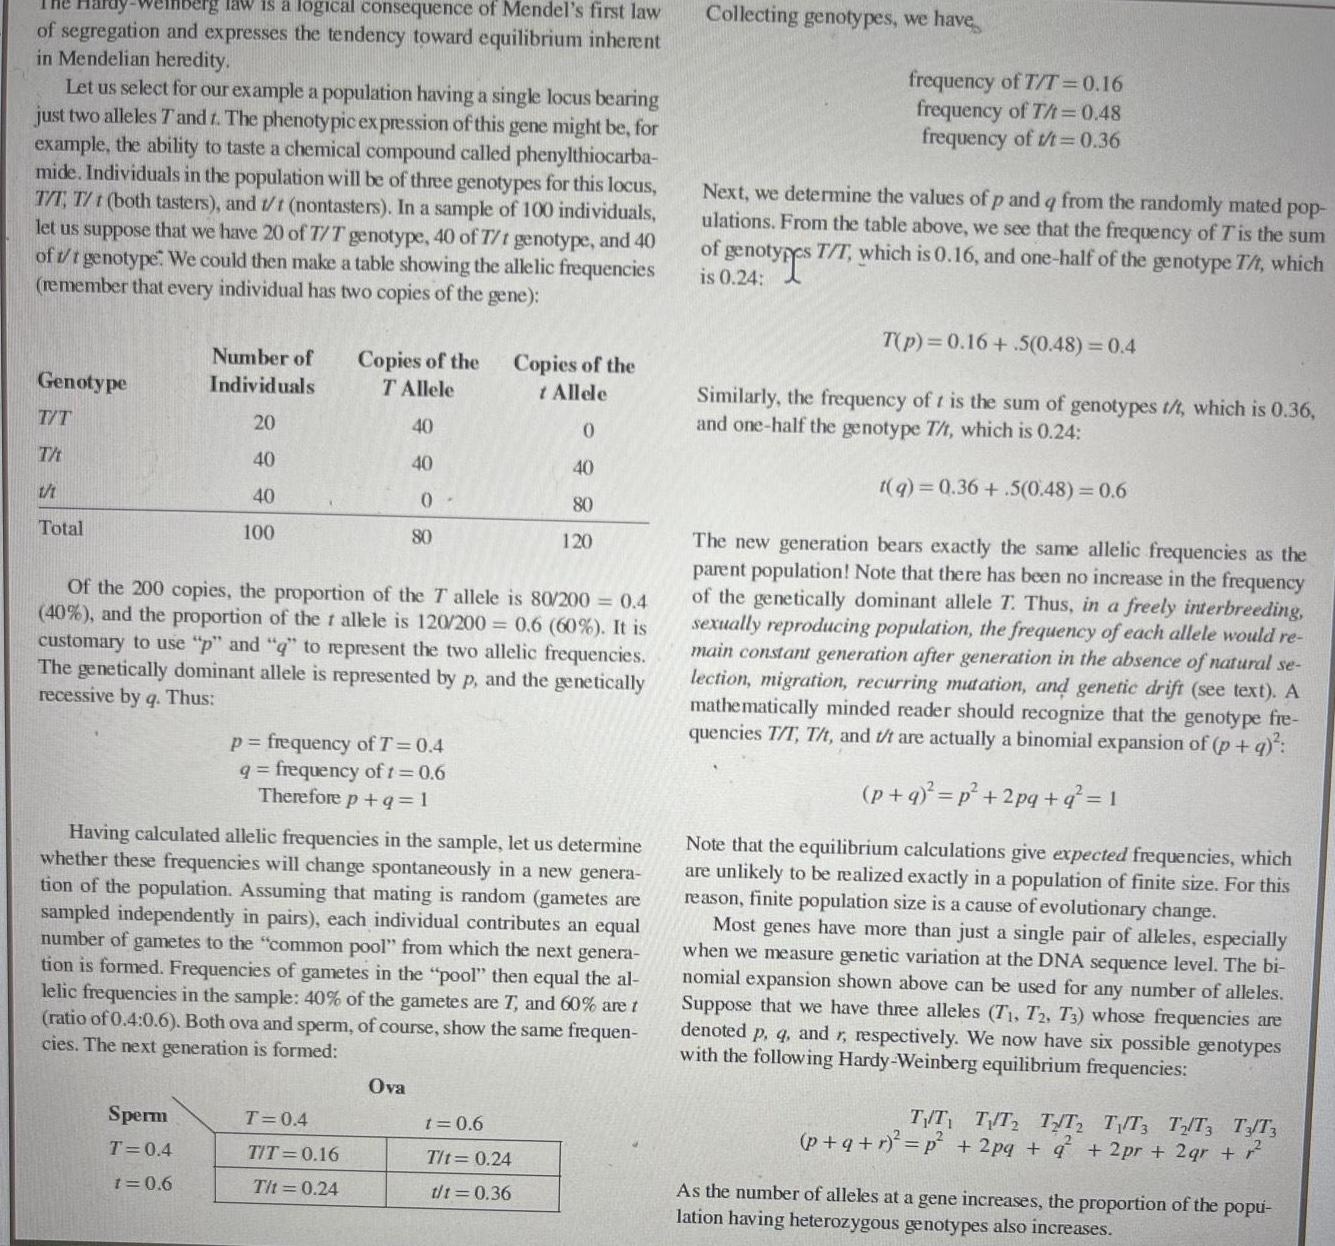
erg law is a logical consequence of Mendel s first law of segregation and expresses the tendency toward equilibrium inherent in Mendelian heredity Let us select for our example a population having a single locus bearing just two alleles T and 1 The phenotypic expression of this gene might be for example the ability to taste a chemical compound called phenylthiocarba mide Individuals in the population will be of three genotypes for this locus T T T t both tasters and t t nontasters In a sample of 100 individuals let us suppose that we have 20 of T T genotype 40 of T t genotype and 40 of t t genotype We could then make a table showing the allelic frequencies remember that every individual has two copies of the gene Genotype T T T V 1 Total Number of Individuals 20 40 40 100 Sperm T 0 4 t 0 6 Copies of the T Allele 40 T 0 4 TIT 0 16 Tit 0 24 40 0 80 Of the 200 copies the proportion of the T allele is 80 200 0 4 40 and the proportion of the r allele is 120 200 0 6 60 It is customary to use p and q to represent the two allelic frequencies The genetically dominant allele is represented by p and the genetically recessive by q Thus p frequency of T 0 4 q frequency of t 0 6 Therefore p q 1 Ova Having calculated allelic frequencies in the sample let us determine whether these frequencies will change spontaneously in a new genera tion of the population Assuming that mating is random gametes are sampled independently in pairs each individual contributes an equal number of gametes to the common pool from which the next genera tion is formed Frequencies of gametes in the pool then equal the al lelic frequencies in the sample 40 of the gametes are T and 60 are t ratio of 0 4 0 6 Both ova and sperm of course show the same frequen cies The next generation is formed Copies of the t Allele 0 40 80 120 t 0 6 T t 0 24 t t 0 36 Collecting genotypes we have frequency of T T 0 16 frequency of T t 0 48 frequency of t t 0 36 Next we determine the values of p and q from the randomly mated pop ulations From the table above we see that the frequency of T is the sum of genotypes T T which is 0 16 and one half of the genotype T t which genotypes is 0 24 T p 0 16 5 0 48 0 4 Similarly the frequency of t is the sum of genotypes t t which is 0 36 and one half the genotype T t which is 0 24 t q 0 36 5 0 48 0 6 The new generation bears exactly the same allelic frequencies as the parent population Note that there has been no increase in the frequency of the genetically dominant allele T Thus in a freely interbreeding sexually reproducing population the frequency of each allele would re main constant generation after generation in the absence of natural se lection migration recurring mutation and genetic drift see text A mathematically minded reader should recognize that the genotype fre quencies T T T t and t t are actually a binomial expansion of p q p q p 2pq q 1 Note that the equilibrium calculations give expected frequencies which are unlikely to be realized exactly in a population of finite size For this reason finite population size is a cause of evolutionary change Most genes have more than just a single pair of alleles especially when we measure genetic variation at the DNA sequence level The bi nomial expansion shown above can be used for any number of alleles Suppose that we have three alleles T T2 T3 whose frequencies are denoted p q and r respectively We now have six possible genotypes with the following Hardy Weinberg equilibrium frequencies TT TT TT TT3 T2 T3 T3 T3 p q r p 2pq q 2pr 2gr As the number of alleles at a gene increases the proportion of the popu lation having heterozygous genotypes also increases