Question:
Following graphs show the variation in the intensity of heat
Last updated: 6/9/2023
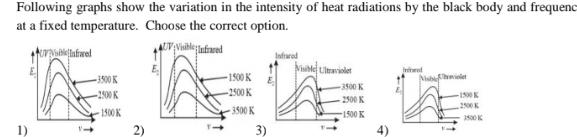
Following graphs show the variation in the intensity of heat radiations by the black body and frequenc at a fixed temperature Choose the correct option 1 Infrared 3500 K 2500 K 1500 K 2 LV Visible Infrared A 1500 K 2500 K 3500 K 3 Infrared Nibe Ultraviolet 3500 K 2500 K 1500 K In Nisbi 1500 2500 2500