have a lifetime of months but the lifetime varies slightly
Last updated: 6/5/2023

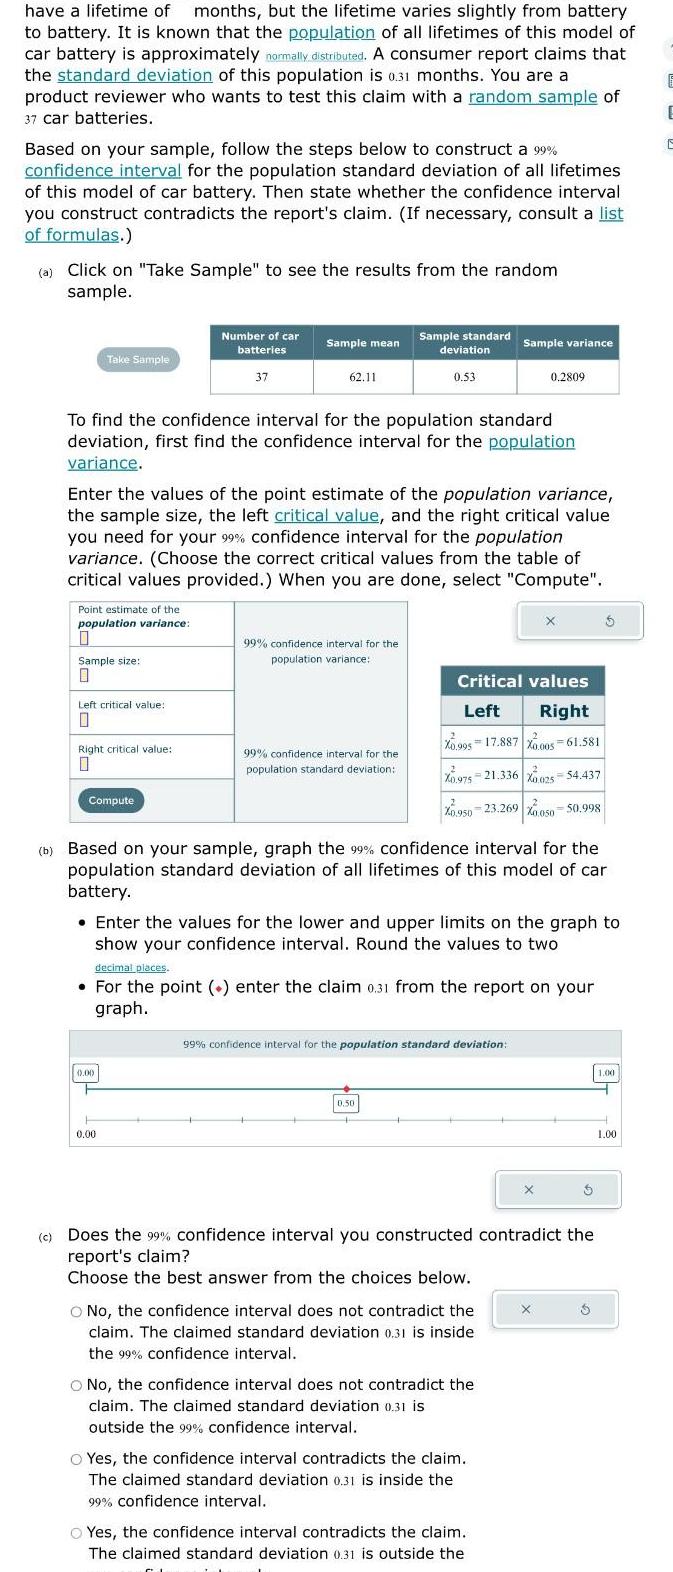
have a lifetime of months but the lifetime varies slightly from battery to battery It is known that the population of all lifetimes of this model of car battery is approximately normally distributed A consumer report claims that the standard deviation of this population is 0 31 months You are a product reviewer who wants to test this claim with a random sample of 37 car batteries Based on your sample follow the steps below to construct a 99 confidence interval for the population standard deviation of all lifetimes of this model of car battery Then state whether the confidence interval you construct contradicts the report s claim If necessary consult a list of formulas a Click on Take Sample to see the results from the random sample Take Sample Point estimate of the population variance 0 Sample size 0 Left critical value 0 Right critical value 0 To find the confidence interval for the population standard deviation first find the confidence interval for the population variance Compute Number of car batteries 37 Enter the values of the point estimate of the population variance the sample size the left critical value and the right critical value you need for your 99 confidence interval for the population variance Choose the correct critical values from the table of critical values provided When you are done select Compute Sample mean 62 11 0 00 0 00 99 confidence interval for the population variance Sample standard deviation 0 53 99 confidence interval for the population standard deviation 0 50 Sample variance Critical values Left Right X0 995 17 887 X0 005 61 581 X0 975 21 336 X0025 54 437 b Based on your sample graph the 99 confidence interval for the population standard deviation of all lifetimes of this model of car battery 2 X0 950 23 269 0 050 50 998 Enter the values for the lower and upper limits on the graph to show your confidence interval Round the values to two decimal places For the point enter the claim 0 31 from the report on your graph 99 confidence interval for the population standard deviation 0 2809 O No the confidence interval does not contradict the claim The claimed standard deviation 0 31 is inside the 99 confidence interval O No the confidence interval does not contradict the claim The claimed standard deviation 0 31 is outside the 99 confidence interval x Yes the confidence interval contradicts the claim The claimed standard deviation 0 31 is inside the 99 confidence interval Yes the confidence interval contradicts the claim The claimed standard deviation 0 31 is outside the X c Does the 99 confidence interval you constructed contradict the report s claim Choose the best answer from the choices below X 3 5 5 1 00 1 00