Question:
In the graph below the red line is the graph of Y1 and the
Last updated: 4/15/2023
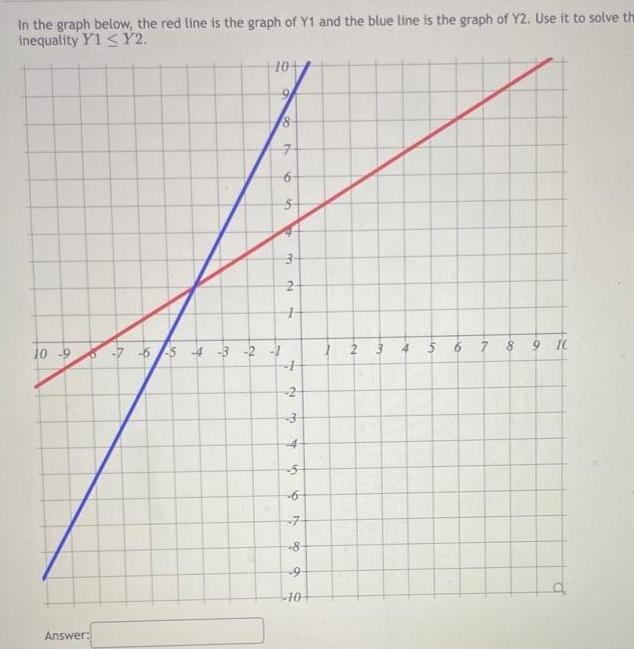
In the graph below the red line is the graph of Y1 and the blue line is the graph of Y2 Use it to solve the inequality Y1Y2 10 9 Answer 10 8 7 6 5 1 3 2 H 7 6 5 4 3 2 1 H 2 100 4 10 6 7 8 9 10 N 3 4 WA 6 7 8 9 TC q