Question:
In the graph shown below the area of the rectangle
Last updated: 5/4/2023
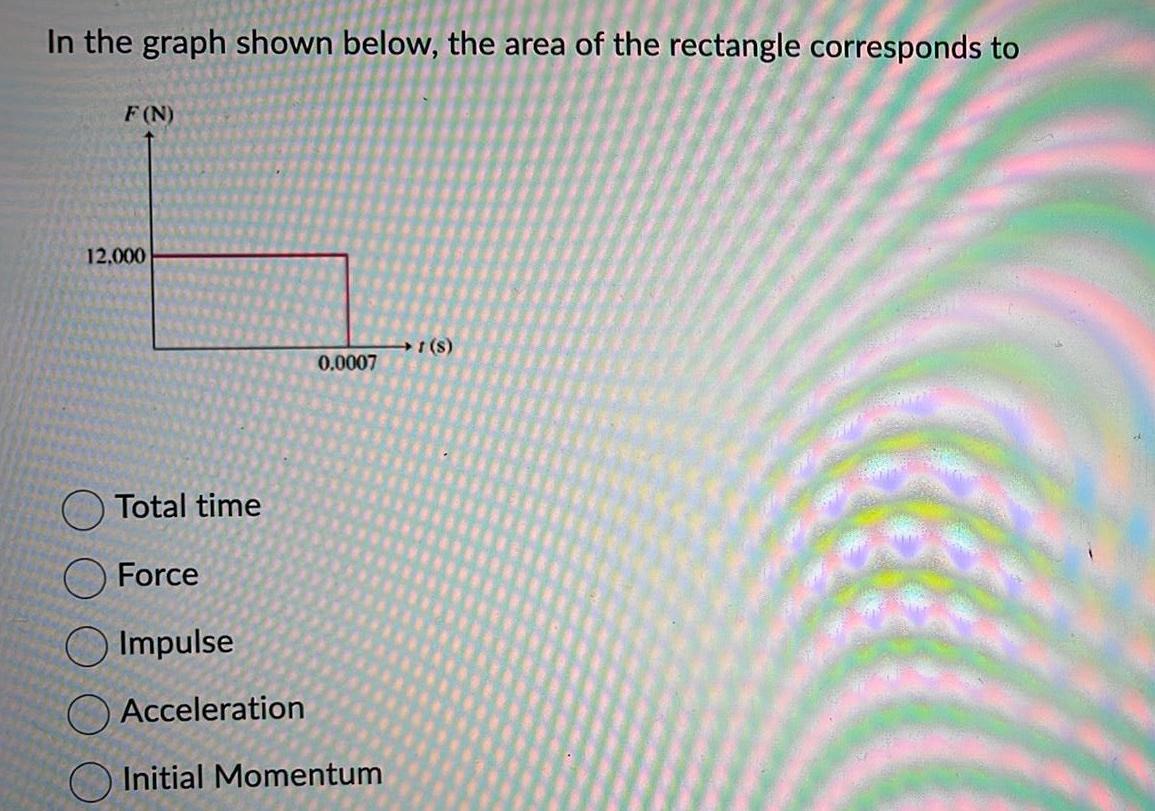
In the graph shown below the area of the rectangle corresponds to F N 12 000 Total time Force Impulse Acceleration 0 0007 Initial Momentum 1 S
Last updated: 5/4/2023
In the graph shown below the area of the rectangle corresponds to F N 12 000 Total time Force Impulse Acceleration 0 0007 Initial Momentum 1 S