Question:
Match the appropriate boxplot to each histogram Frequency
Last updated: 4/16/2023
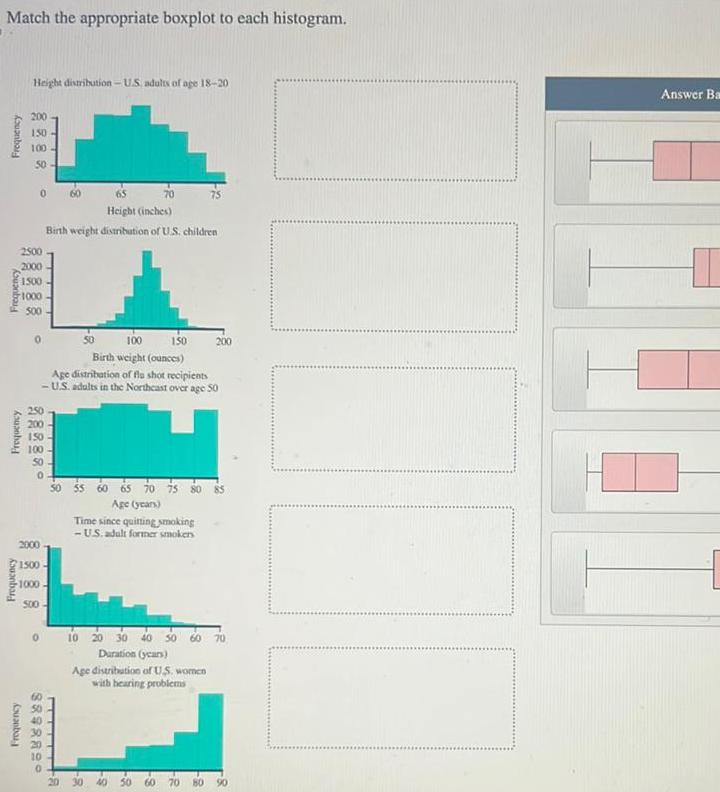
Match the appropriate boxplot to each histogram Frequency Frequency Frequency Frequency Height distribution US adults of age 18 20 200 150 100 50 2500 2000 1500 1000 500 0 0 150 100 0 65 70 Height inches Birth weight distribution of U S children 2000 1500 1000 500 60 T 50 Birth weight ounces Age distribution of flu shot recipients U S adults in the Northeast over age 50 Frequency 0588888 60 A 75 100 150 200 60 65 70 75 80 Age years Time since quitting smoking U S adult former smokers 20 30 10 20 30 40 50 60 70 Duration years Age distribution of US women with hearing problems 40 50 60 70 80 90 Answer Ba