Percent of children 30 20 10 O Without character Taste the
Last updated: 4/16/2023
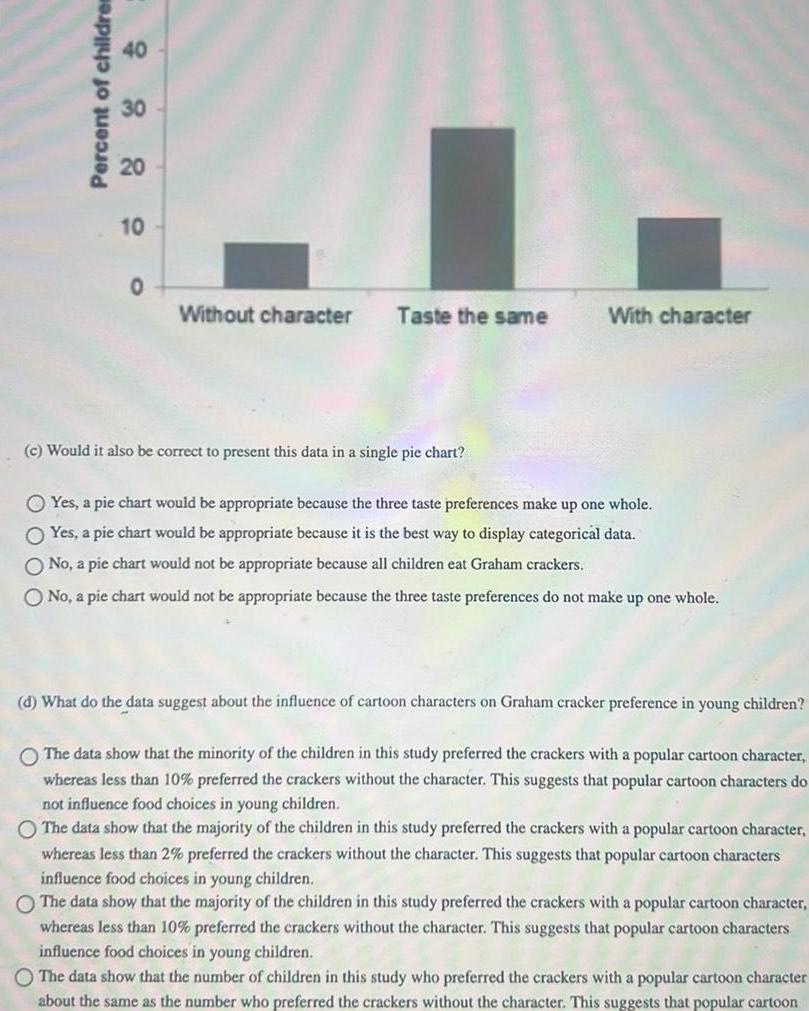
Percent of children 30 20 10 O Without character Taste the same c Would it also be correct to present this data in a single pie chart With character O Yes a pie chart would be appropriate because the three taste preferences make up one whole O Yes a pie chart would be appropriate because it is the best way to display categorical data O No a pie chart would not be appropriate because all children eat Graham crackers O No a pie chart would not be appropriate because the three taste preferences do not make up one whole d What do the data suggest about the influence of cartoon characters on Graham cracker preference in young children O The data show that the minority of the children in this study preferred the crackers with a popular cartoon character whereas less than 10 preferred the crackers without the character This suggests that popular cartoon characters do not influence food choices in young children O The data show that the majority of the children in this study preferred the crackers with a popular cartoon character whereas less than 2 preferred the crackers without the character This suggests that popular cartoon characters influence food choices in young children The data show that the majority of the children in this study preferred the crackers with a popular cartoon character whereas less than 10 preferred the crackers without the character This suggests that popular cartoon characters influence food choices in young children O The data show that the number of children in this study who preferred the crackers with a popular cartoon character about the same as the number who preferred the crackers without the character This suggests that popular cartoon