The accompanying data represent the pulse rates (beats per
Last updated: 7/10/2022
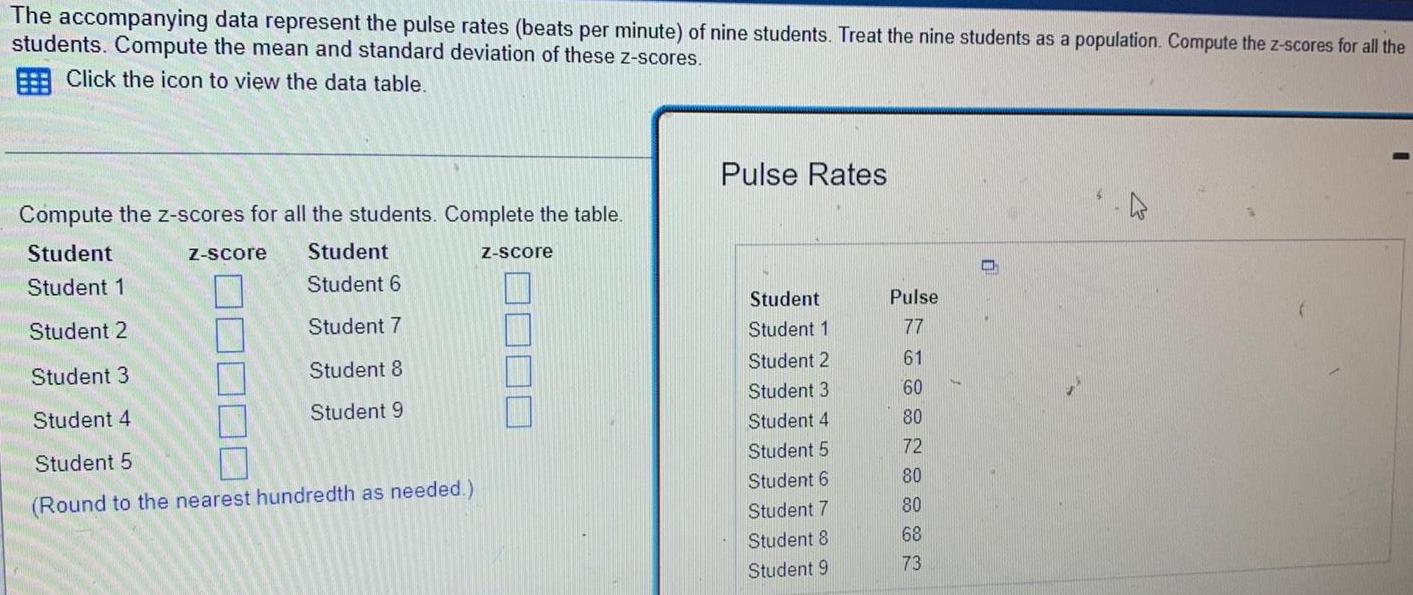
The accompanying data represent the pulse rates (beats per minute) of nine students. Treat the nine students as a population. Compute the z-scores for all the students. Compute the mean and standard deviation of these z-scores. Compute the z-scores for all the students. Complete the table. Student Z-score Student 1 Student 2 Student 3 Student 4 Student 5 Student 6 Student 7 Student 8 Student 9 Pulse Rates Student Pulse Student 1 77 Student 2 61 Student 3 60 Student 4 80 Student 5 72 Student 6 80 Student 7 80 Student 8 68 Student 9 73