Question:
The figure shows the force F versus displacement s graph for
Last updated: 6/13/2023
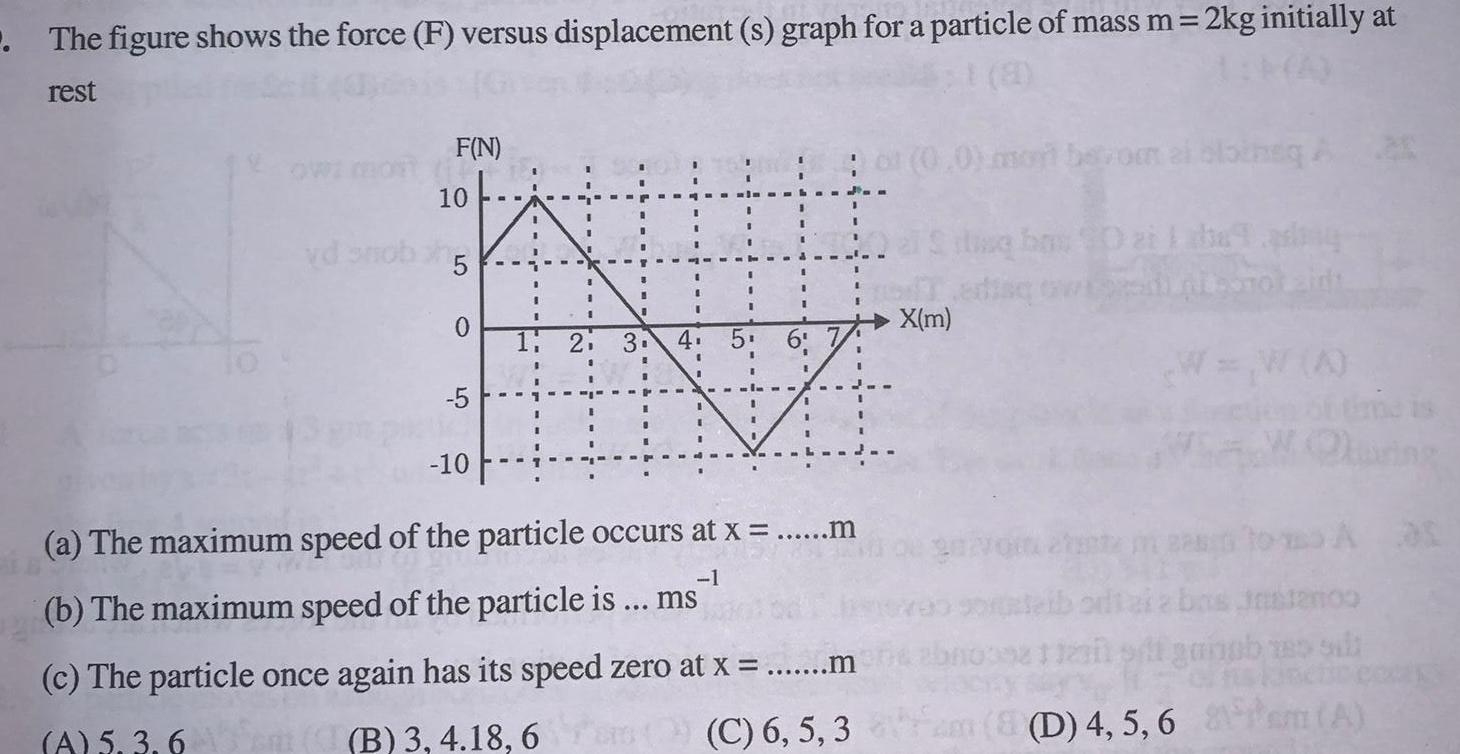
The figure shows the force F versus displacement s graph for a particle of mass m 2kg initially at rest F N 14 10 5 0 5 10 1 2 3 I 6 NA a The maximum speed of the particle occurs at x m 1 b The maximum speed of the particle is ms c The particle once again has its speed zero at x m A 5 3 6 B 3 4 18 6m C 6 5 3 0 mont bevom al blbineg ling bax 90 zi l be ad all pleomor X m 0398 112ail silf ganaba silt m 8 D 4 5 6 m A is