Question:
The following frequency distribution presents the batting
Last updated: 7/27/2022
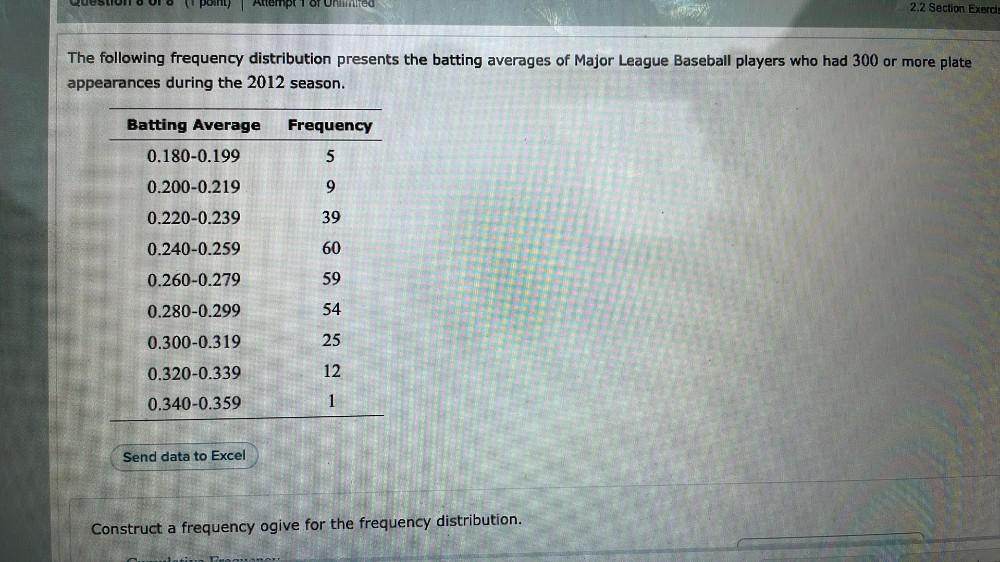
The following frequency distribution presents the batting averages of Major League Baseball players who had 300 or more plate appearances during the 2012 season. Batting Average Frequency 0.180-0.199 5 0.200-0.219 9 0.220-0.239 39 0.240-0.259 60 0.260-0.279 59 0.280-0.299 54 0.300-0.319 25 0.320-0.339 12 0.340-0.359 1 Construct a frequency ogive for the frequency distribution.