Question:
The following table is the frequency distribution for the
Last updated: 2/3/2023
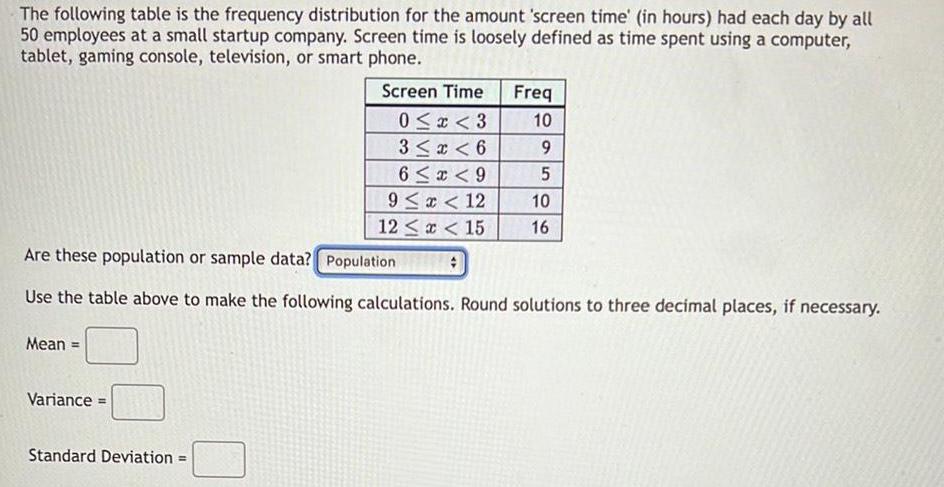
The following table is the frequency distribution for the amount screen time in hours had each day by all 50 employees at a small startup company Screen time is loosely defined as time spent using a computer tablet gaming console television or smart phone Screen Time 0 x 3 3 x 6 6 x 9 9 x 12 12 x 15 Are these population or sample data Population Use the table above to make the following calculations Round solutions to three decimal places if necessary Mean Variance Standard Deviation Freq 10 9 5 10 16