Question:
The graph below represents the growth of Jame s giant peach
Last updated: 6/12/2023
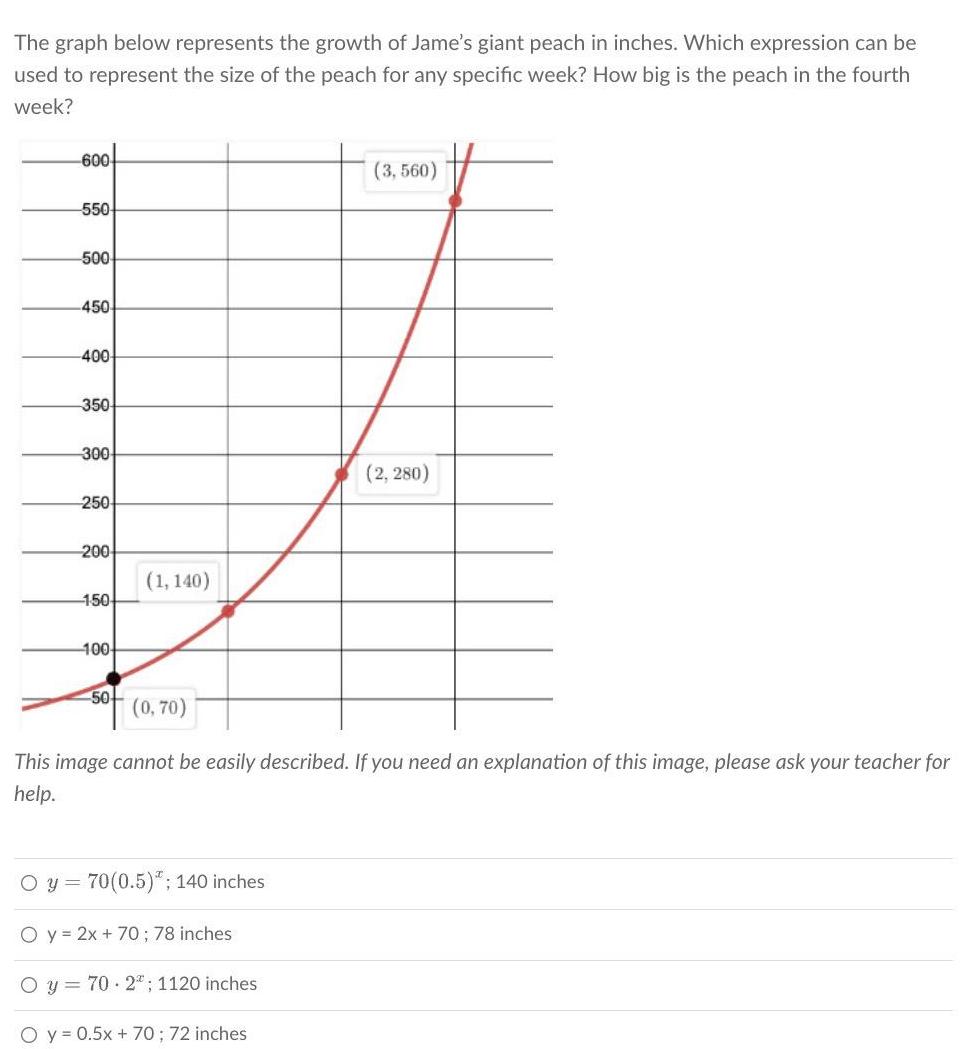
The graph below represents the growth of Jame s giant peach in inches Which expression can be used to represent the size of the peach for any specific week How big is the peach in the fourth week 600 550 500 450 400 350 300 250 200 150 100 50 1 140 Oy 70 0 5 140 inches 0 70 This image cannot be easily described If you need an explanation of this image please ask your teacher for help Oy 2x 70 78 inches O y 70 2 1120 inches 3 560 O y 0 5x 70 72 inches 2 280