Question:
The graphs of total revenue R total cost C variable cost VC
Last updated: 2/2/2023
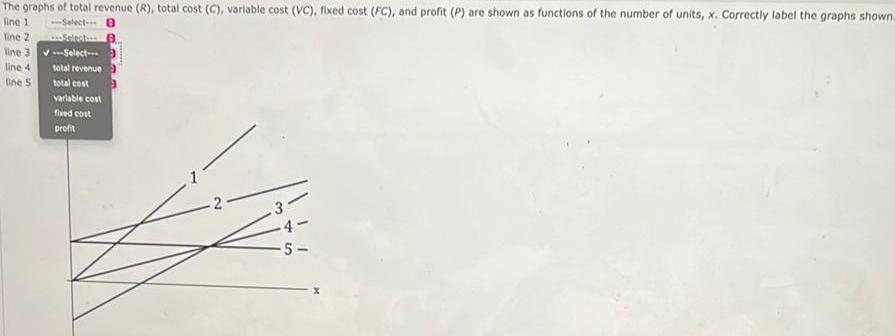
The graphs of total revenue R total cost C variable cost VC fixed cost FC and profit P are shown as functions of the number of units x Correctly label the graphs shown line 1 Select B line 2 Select Select line 3 line 4 line 5 total revenue total cost variable cost fixed cost profit 2 3 4 5