The normal quantile plot shown to the right represents
Last updated: 4/24/2023
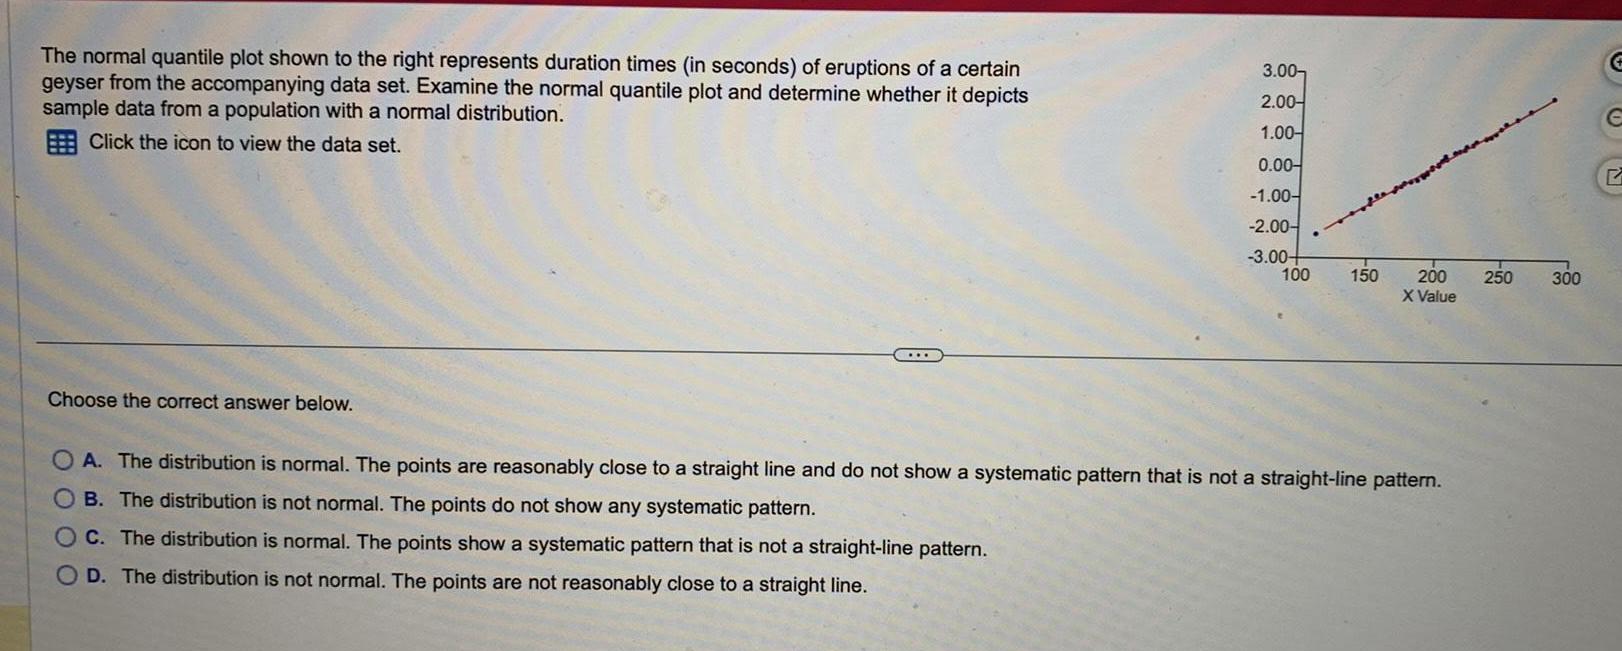
The normal quantile plot shown to the right represents duration times in seconds of eruptions of a certain geyser from the accompanying data set Examine the normal quantile plot and determine whether it depicts sample data from a population with a normal distribution Click the icon to view the data set Choose the correct answer below 3 00 2 00 1 00 0 00 1 00 2 00 3 00 100 150 200 X Value OA The distribution is normal The points are reasonably close to a straight line and do not show a systematic pattern that is not a straight line pattern OB The distribution is not normal The points do not show any systematic pattern OC The distribution is normal The points show a systematic pattern that is not a straight line pattern OD The distribution is not normal The points are not reasonably close to a straight line 250 300 G