Question:
The scatter plot shows the distance d in miles between a
Last updated: 4/21/2023
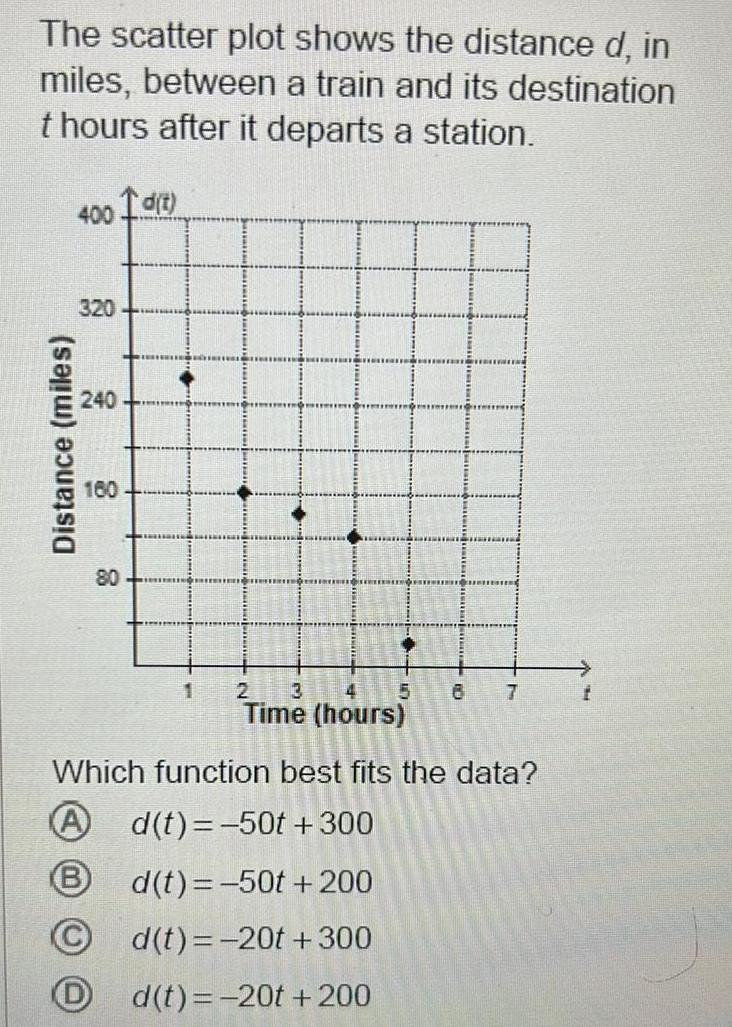
The scatter plot shows the distance d in miles between a train and its destination t hours after it departs a station Distance miles 400 320 240 160 80 d t 1 2 3 4 Time hours 5 7 Which function best fits the data Ad t 50t 300 B d t 50t 200 d t 20t 300 d t 20t 200 f