Question:
The scatter plot shows the time spent studying compared to
Last updated: 2/1/2023
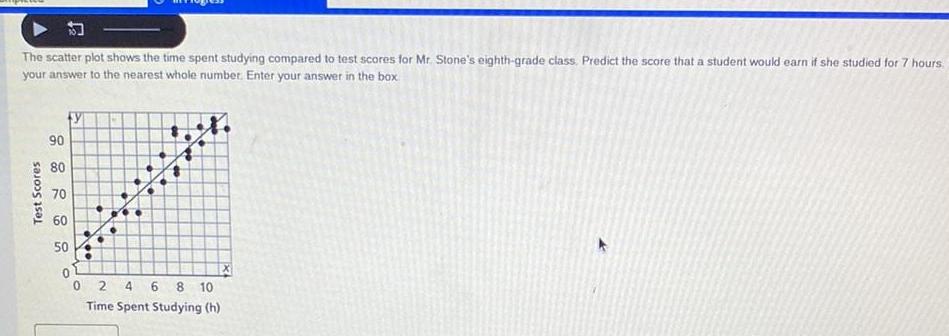
The scatter plot shows the time spent studying compared to test scores for Mr Stone s eighth grade class Predict the score that a student would earn if she studied for 7 hours your answer to the nearest whole number Enter your answer in the box Test Scores Fy 90 80 70 60 50 0 0 H 246 8 10 Time Spent Studying h