Question:
tion 2 of 13 Macmillan Learning Classify each histogram
Last updated: 4/16/2023
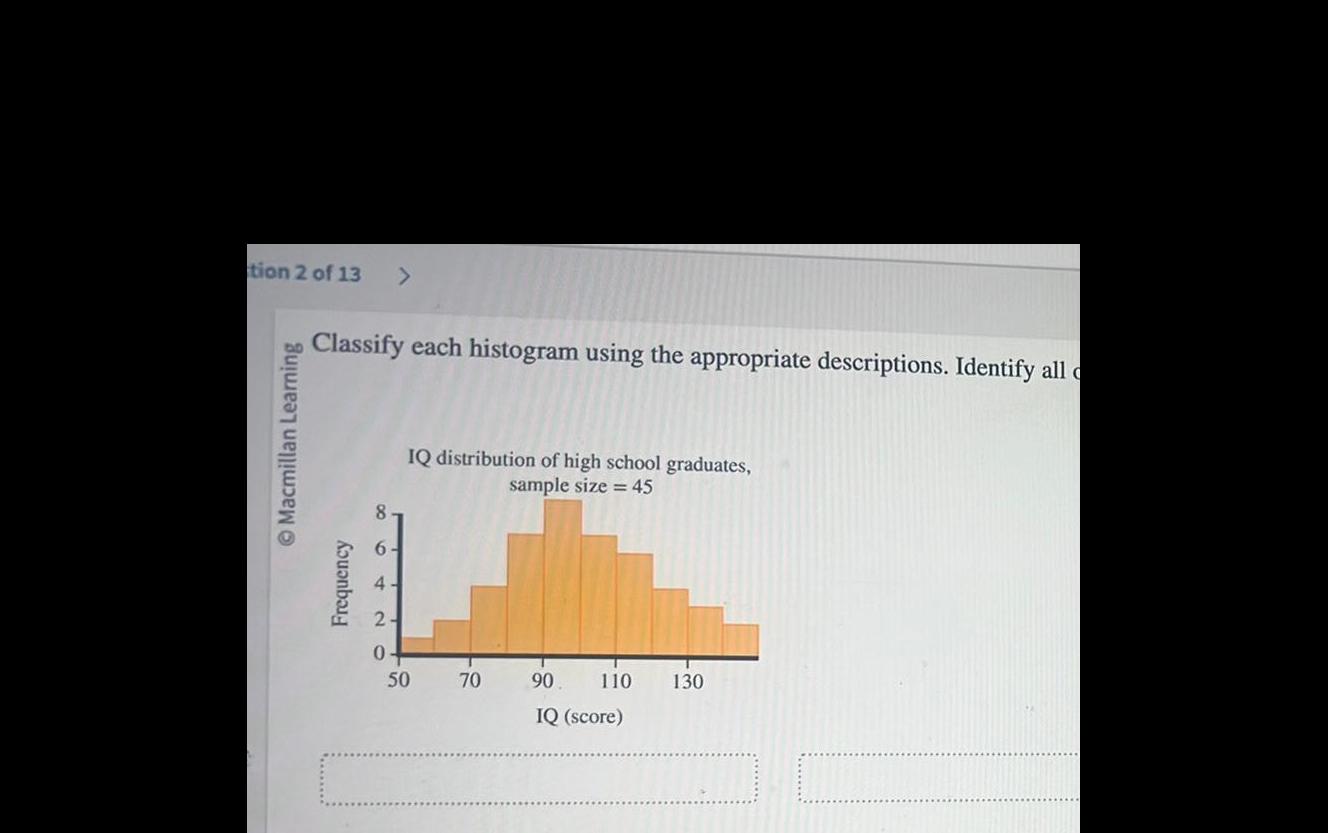
tion 2 of 13 Macmillan Learning Classify each histogram using the appropriate descriptions Identify all Frequency 420 IQ distribution of high school graduates sample size 45 50 70 90 IQ score 110 130