Question:
To test Ho 20 versus H 20 a simple random sample of size n
Last updated: 7/27/2023
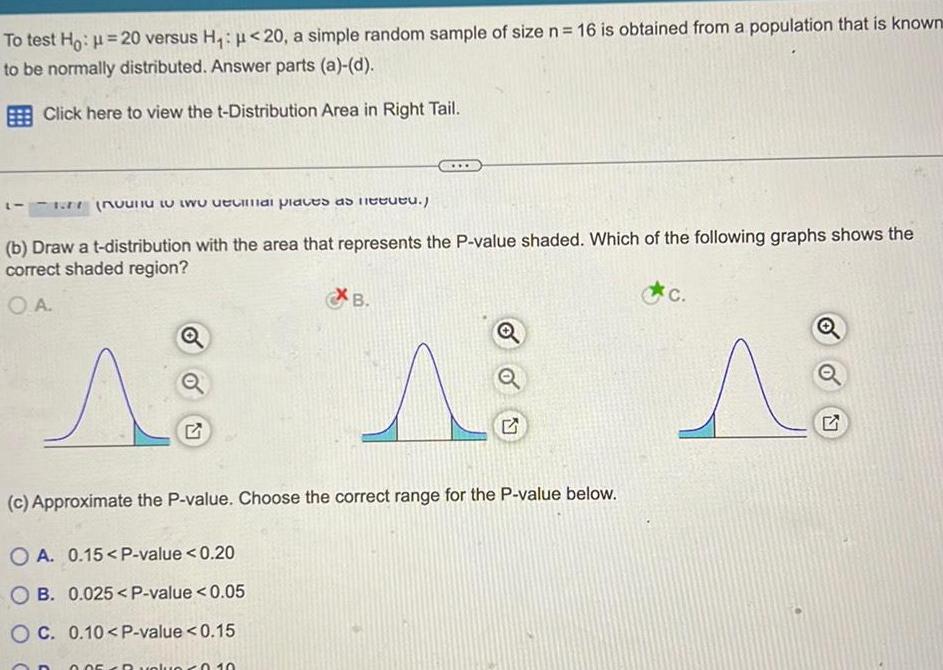
To test Ho 20 versus H 20 a simple random sample of size n 16 is obtained from a population that is known to be normally distributed Answer parts a d Click here to view the t Distribution Area in Right Tail RONG to two decimal places as need b Draw a t distribution with the area that represents the P value shaded Which of the following graphs shows the correct shaded region O A B c Approximate the P value Choose the correct range for the P value below OA 0 15 P value 0 20 OB 0 025 P value 0 05 OC 0 10 P value 0 15 0 05 R value 0 10 C Q Q