Question:
Use a graphing calculator to find a linear model for the set
Last updated: 7/24/2022
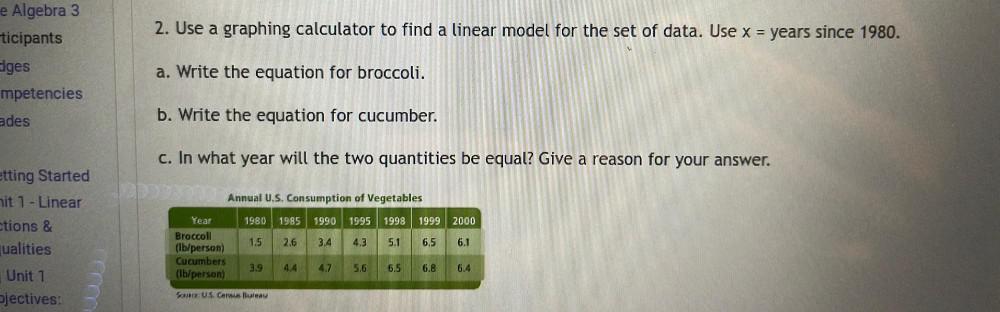
Use a graphing calculator to find a linear model for the set of data. Use x = years since 1980. (a.) Write the equation for broccoli. (b.) Write the equation for cucumber. (c.) In what year will the two quantities be equal? Give a reason for your answer. Annual U.S. Consumption of Vegetables Year 1980 1985 1990 1995 1998 1999 2000 Broccoll (Ib/person) 1.5 2.6 3.4 4.3 5.1 6.5 6.1 Cucumbers (Ib/person) 3.9 4.4 4.7 5.6 6.5 6.8 6.4