will be for a range of values and represented by the area
Last updated: 11/15/2023
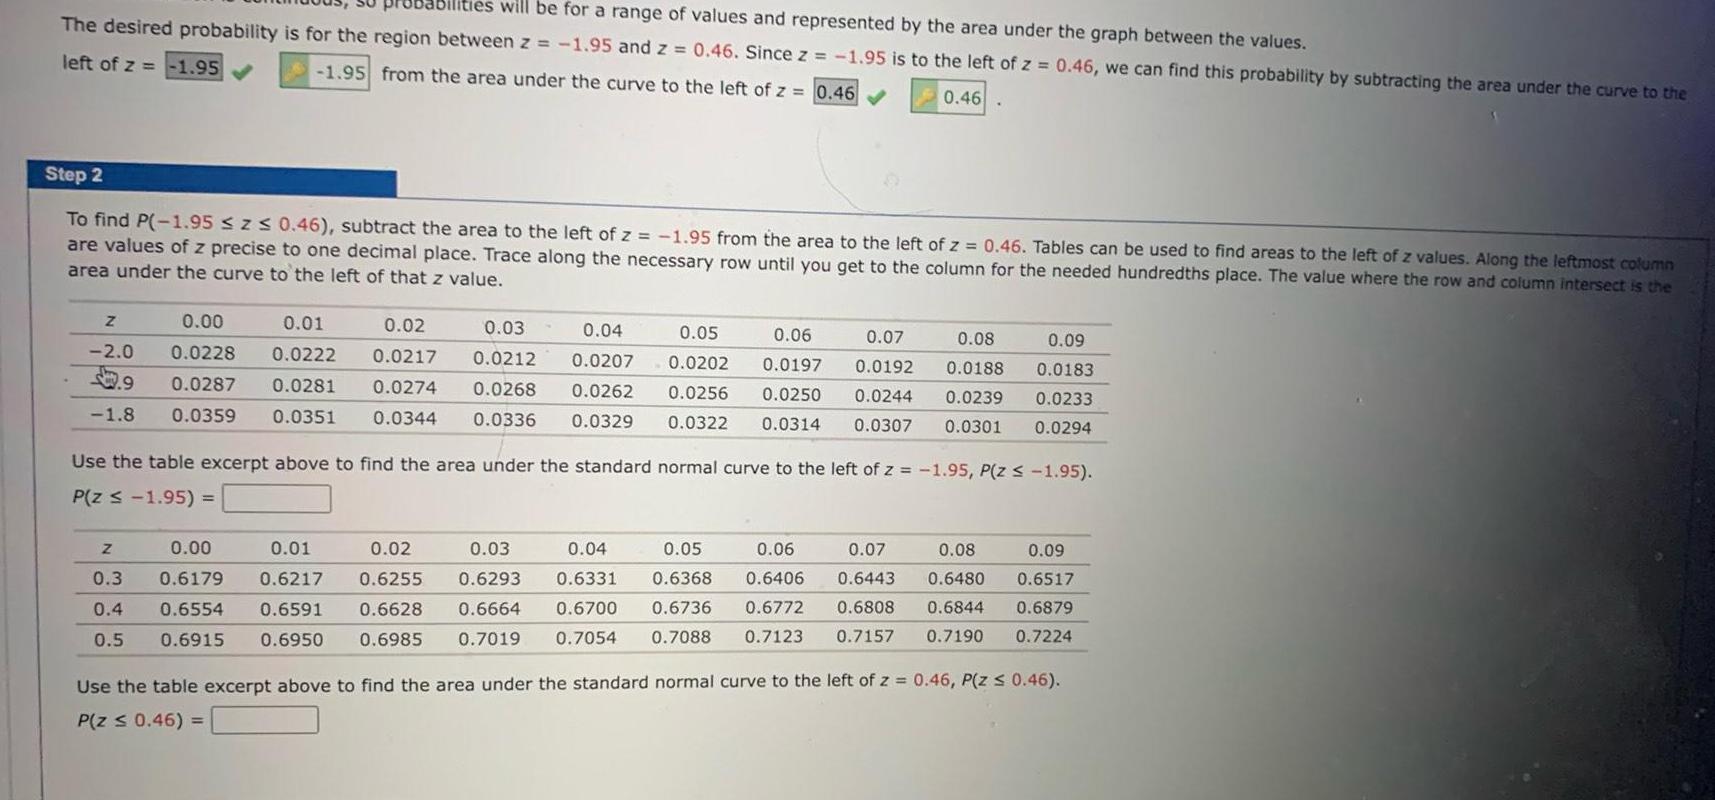
will be for a range of values and represented by the area under the graph between the values The desired probability is for the region between z 1 95 and z 0 46 Since z 1 95 is to the left of z 0 46 we can find this probability by subtracting the area under the curve to the left of z 1 95 1 95 from the area under the curve to the left of z 0 46 0 46 Step 2 To find P 1 95 z 0 46 subtract the area to the left of z 1 95 from the area to the left of z 0 46 Tables can be used to find areas to the left of z values Along the leftmost column are values of z precise to one decimal place Trace along the necessary row until you get to the column for the needed hundredths place The value where the row and column intersect is the area under the curve to the left of that z value Z 2 0 0 08 0 09 0 0188 0 0183 0 0239 0 0233 0 00 0 01 0 02 0 03 0 04 0 05 0 06 0 07 0 0228 0 0222 0 0217 0 0212 0 0207 0 0202 0 0197 0 0192 2 9 0 0287 0 0281 0 0274 0 0268 0 0262 0 0256 0 0250 0 0244 1 8 0 0359 0 0351 0 0344 0 0336 0 0329 0 0322 0 0314 0 0307 0 0301 0 0294 Use the table excerpt above to find the area under the standard normal curve to the left of z 1 95 P z 1 95 P Z 1 95 Z 0 00 0 01 0 02 0 03 0 05 0 06 0 3 0 6179 0 6217 0 6255 0 6293 0 6368 0 6406 0 4 0 6554 0 6591 0 6628 0 6664 0 6736 0 6772 0 5 0 6915 0 6950 0 6985 0 7019 0 7054 0 7088 0 7123 0 7157 0 04 0 6331 0 6700 0 07 0 08 0 6443 0 6480 0 6808 0 6844 0 7190 0 09 0 6517 0 6879 0 7224 Use the table excerpt above to find the area under the standard normal curve to the left of z 0 46 P Z 0 46 P Z 0 46