Question:
y 8 6 75 2 3 Which equation best represents the data shown
Last updated: 5/21/2023
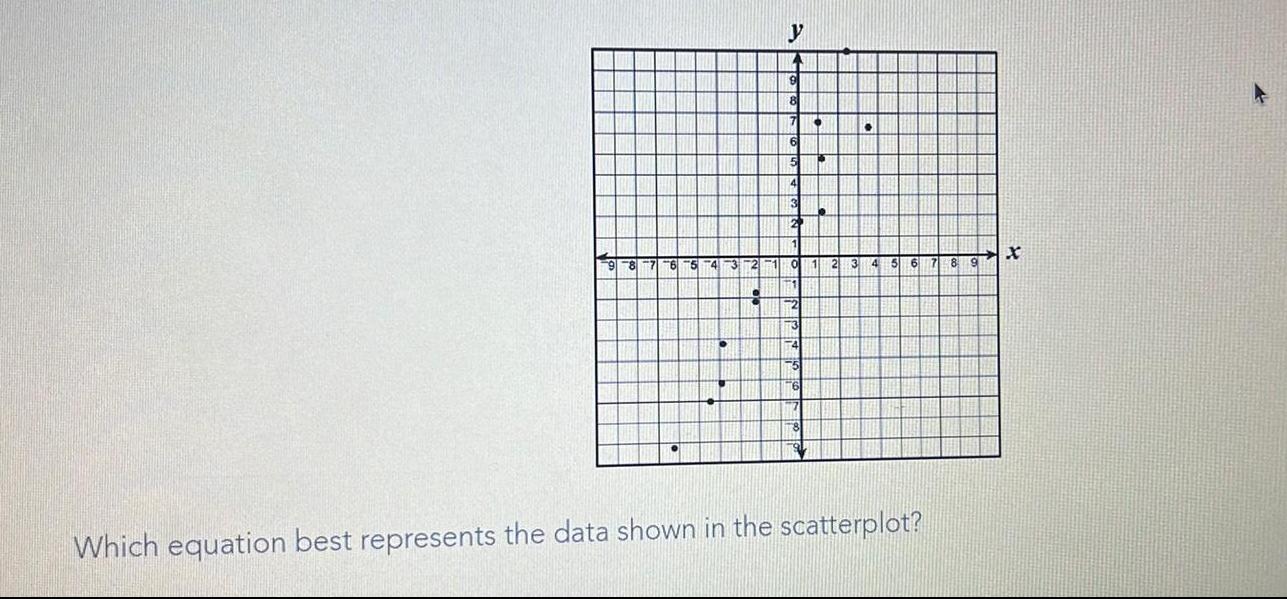
y 8 6 75 2 3 Which equation best represents the data shown in the scatterplot 8 9 X
Last updated: 5/21/2023
y 8 6 75 2 3 Which equation best represents the data shown in the scatterplot 8 9 X