Differential equations Questions and Answers

High School Calculus
Differential equationsSolve the differential equation with the given conditions 21 f x 12x 6x 1 and f 1 5


High School Calculus
Differential equationsa To graph the relation P 1 5 x 2 4x 60 we ll plot points for different values of x and calculate the corresponding P values using equation Then we ll plot these points on a graph b This relation is quadratic because it has a squared term x 2 in the equation Another way to see this is by noting that the graph of a quadratic equation is a parabola and the given equation has the form of a quadratic function the c The direction of opening of the parabola is downward because the coefficient of the x 2 term 1 5 is negative Since the coefficient of the x 2 term negative the parabola opens downward indicating that the profit function has a maximum We know this because the coefficient of x 2 is negative is d To find the P intercept we set x 0 in the equation and solve for P P 1 5 0 2 4 0 60 60 The P intercept is 0 60 This represents the initial profit of the company in 2020 when x 0 Yes it makes sense that this is a new company because at the beginning in 2020 the profit is 60 million As the company grows and operates the profit can increase or decrease based on various factors
High School Calculus
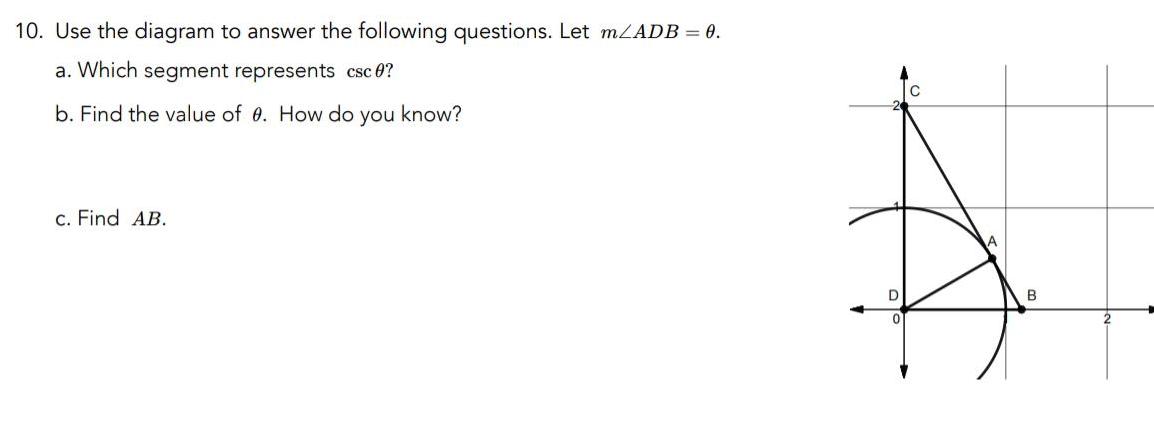
Differential equations10 Use the diagram to answer the following questions Let m ADB 0 a Which segment represents csc 0 b Find the value of 0 How do you know c Find AB A 2
High School Calculus
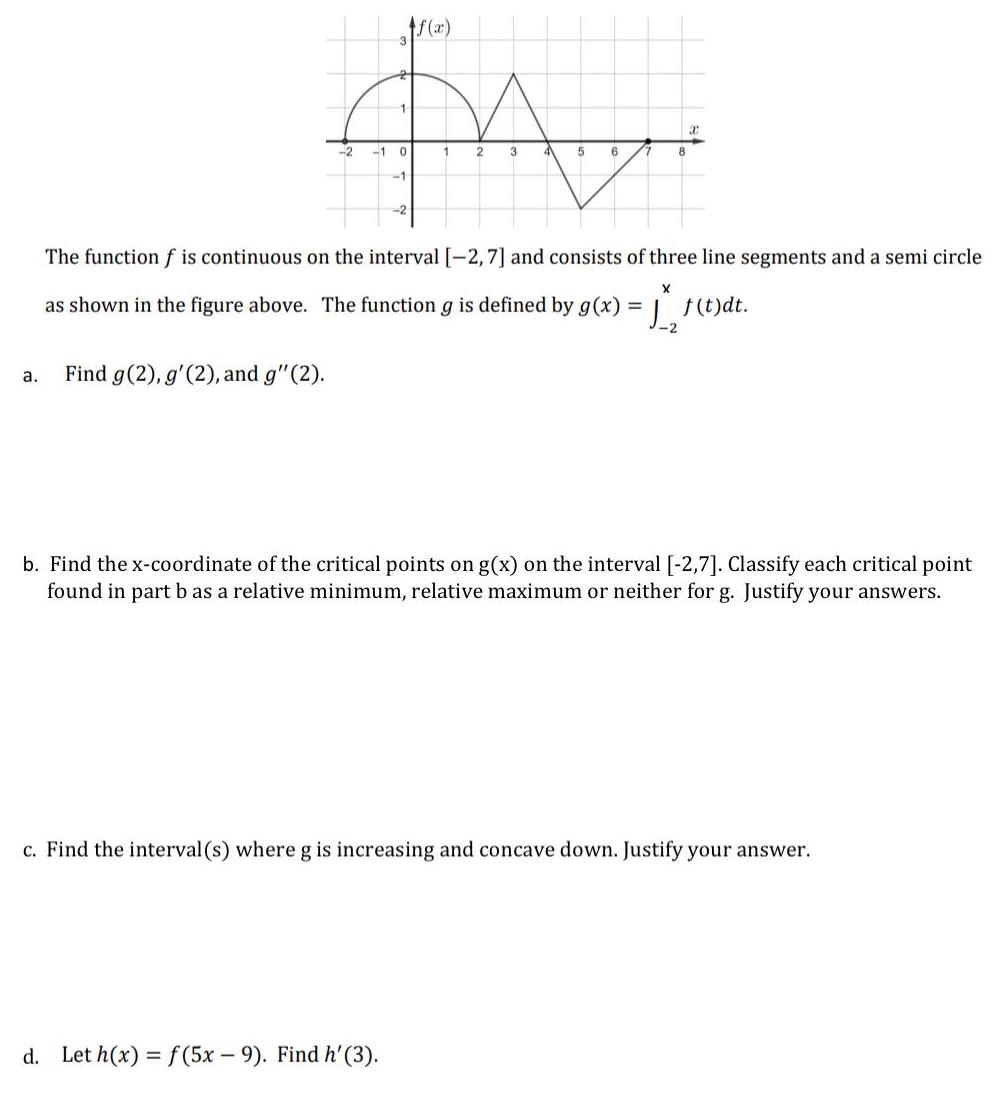
Differential equationsa f x 1 M 2 1 0 1 1 Find g 2 g 2 and g 2 2 5 6 7 8 The function f is continuous on the interval 2 7 and consists of three line segments and a semi circle as shown in the figure above The function g is defined by g x d Let h x f 5x 9 Find h 3 2 X J f t dt 2 b Find the x coordinate of the critical points on g x on the interval 2 7 Classify each critical point found in part b as a relative minimum relative maximum or neither for g Justify your answers c Find the interval s where g is increasing and concave down Justify your answer

High School Calculus
Differential equationsChoose the correct graph and explain your choice 1 y tan 20 A B D x fr Cr 12 T 3r 2x 27 3x 3

High School Calculus
Differential equations4 A particle moves along a line so that its position at any time t 0 is given by the function s t t 3t 8t 5 where s is measured in meters and t is measured in seconds a Find the instantaneous velocity at any time t b When is the particle at rest c Find the acceleration of the particle at any time t d What is the displacement of the particle for the first 3 seconds

High School Calculus
Differential equations1 Let f x 2e x and g x 5x At what value of x do the graphs of f and g have parallel tangents a 0 445 b 0 366 Graph of f c 0 344 d 0 251

High School Calculus
Differential equationsStandard 6 NR 4 1 The ratio of squirrels to pigeons in the park is 15 to 125 Which statement describes this relationship O There are 3 squirrels for every 25 pigeons in the park O There are 3 squirrels for every 5 pigeons in the park O There are 5 squirrels for every 3 pigeons in the park There are 25 squirrels for every 3 pigeons in the park

High School Calculus
Differential equationsy x5 5x 4x a Find the zeros algebraically Enter your answers as a comma separated list If there are no real zeros enter DNE X b Use a graphing utility to graph the function y O 4 4 4 2 y A 2 4 X 4 y M 4 2
1