Math - Others Questions
The best high school and college tutors are just a click away, 24×7! Pick a subject, ask a question, and get a detailed, handwritten solution personalized for you in minutes. We cover Math, Physics, Chemistry & Biology.

Math - Others
Mathematical ReasoningBook Hint Print erences Required information The following information applies to the questions displayed below At year end December 31 Chan Company estimates its bad debts as 0 40 of its annual credit sales of 957 000 Chan records its bad debts expense for that estimate On the following February 1 Chan decides that the 479 account of P Park is uncollectible and writes it off as a bad debt On June 5 Park unexpectedly pays the amount previously written off Prepare Chan s journal entries to record the transactions of December 31 February 1 and June 5 View transaction list Journal entry worksheet 1 2 3 4 Record the estimated bad debts expense

Math - Others
Linear Programmingts eBook Hint Print eferences b Prepare the adjusting entry to record bad debts expense using the estimate from part a Assume the unadjusted balance in the Allowance for Doubtful Accounts is a 4 500 credit c Prepare the adjusting entry to record bad debts expense using the estimate from part a Assume the unadjusted balance in the Allowance for Doubtful Accounts is a 1 000 debit View transaction list Journal entry worksheet 1 2 Record estimated bad debts assuming that Allowance for Doubtful Accounts has a 4 500 credit balance Show less A

Math - Others
Mathematical Reasoning1 36 ints eBook Hint Print References Vall Company recorded the following transactions during November Date November 5 November 10 November 13 November 21 November 30 General Journal Accounts Receivable Ski Shop Sales Accounts Receivable Welcome Incorporated Sales Accounts Receivable Zia Company Sales Sales Returns and Allowances Accounts Receivable Zia Company Accounts Receivable Ski Shop Sales Debit 5 690 2 274 1 333 Required 1 Required 2 344 4 741 Complete this question by entering your answers in the tabs below Credit 5 690 2 274 1 333 344 1 Post these entries to both the general ledger accounts and the accounts receivable ledger subsidiary ledger accounts 2 Prepare a schedule of accounts receivable 4 741 Post these entries to both the general ledger accounts and the accounts receivable ledger subsidiary ledger accounts General Ledger Accounts Receivable Subsidiary Ledger Skl Shop Accounts Receivable

Math - Others
Basic Math1 This refers to the relative thickness of a font s stroke 2 A typeface without serifs is called a serif typeface 3 This refers to how easy it is to read words or blocks of text which is affected by the style of a typeface refers to the uniform adjustment 4 Letter spacing also called of the space between letters in a piece of text 5 What typeface was John Baskerville famous for designing one word 6 This typographer was responsible for designing London s street signs first and last name 7 This typographer apprenticed with Antoine Augereau first and last name 8 Who designed they typeface Times New Roman first and last name 9 Who is the only typographer on this list who designed for Adobe first and last name 10 Paul Renner designed this extremely popular typeface in Germany one word

Math - Others
Mathematical ReasoningLem Nganje The following data were gathered by the owners of a hot chocolate stand The average daily temperatures are in degrees Celsius a Plot the data using technology then choose the best description below positive linear correlation a Avg Daily Temp y Cups Sold 16 55 16 52 14 52 23 41 18 42 19 37 27 28 26 26 negative linear correlation no linear correlation Question 2 of 2 b Use technology to find the regression line Identify the slope of the regression line Round to two decimal places 9 64 10 e Using the regression line predict the number of cups of hot chocolate that would be sold on a day when the average temperature is 9 C Round to two decimal places y 64 10 cups f Using the repression line

Math - Others
FunctionsThe function f x 8x arctan 5x is represented as a power series f x Find the first few coefficients in the power series CO C1 C2 C3 C4 IL Find the radius of convergence R of the series R Cn x n 0

Math - Others
Basic MathThe table below provides population facts about the world and two of its most populous countries India and China Current Population Region World China India millions h 8 057 5 1 448 1 1 401 6 Percent of Population by Age Greater than 65 9 3 11 9 6 5 Less than 15 25 4 0 21 5 26 1 According to the table the current population of the world is j 8 057 5 the population of the world in ordinary notation 057 500 000 million million people Write 2 b What percent of the population of the world lives in countries other than China or India Round your result to the nearest whole number c According to the table k 21 5 of the people who live in China are less than 15 years old and 11 9 are greater than 65 years old What percent of the people
Math - Others
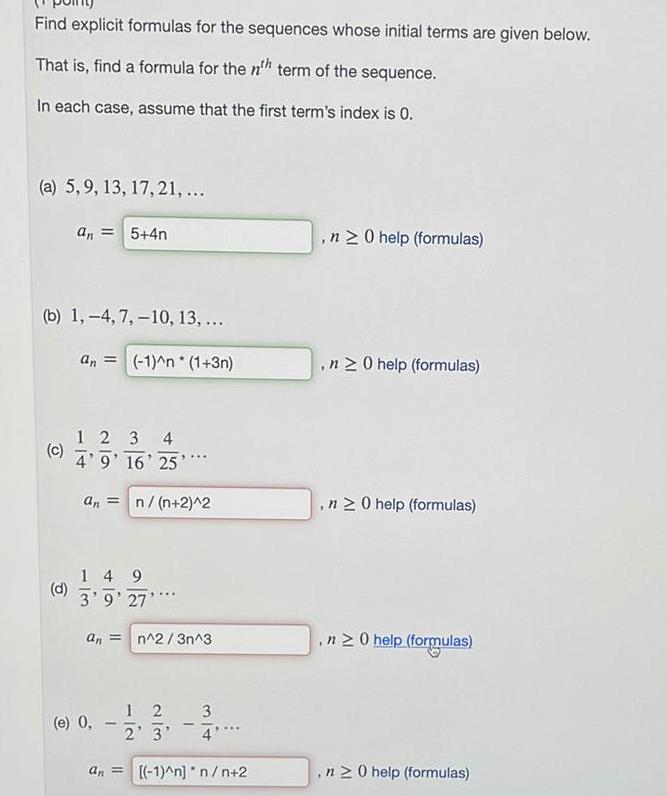
Basic MathFind explicit formulas for the sequences whose initial terms are given below That is find a formula for the nth term of the sequence In each case assume that the first term s index is 0 a 5 9 13 17 21 b 1 4 7 10 c an 5 4n d 13 an 1 n 1 3n 1 2 3 4 4 9 16 25 an n n 2 2 149 3 9 27 an n 2 3n 3 e 0 1 12 2 3 3 an 1 n n n 2 n 0 help formulas n20 help formulas n20 help formulas n 0 help formulas n20 help formulas

Math - Others
Basic Math7 The table below displays the percent of Japan s population in each age group over the last 40 years Japan 1980 2020 Percent of population under age 15 n 17 09 Percent of population over age 65 a Calculate the absolute change in the percent of the population that is under the age of 15 between 1980 and 2020 Round your result to two decimal places 3 c Calculate the absolute change in the percent of the population that is over the age of 65 between 1980 and 2020 Round your result to two decimal places 3 12 45 8 91 o 22 33 b Calculate the relative change in the percent of the population that is under the age of 15 between 1980 and 2020 Round your result to one decimal place 4 d Calculate the relative change in the percent of the population that is over the age of 65 between 1980 and 2020 Round your result to one decimal place 4

Math - Others
Basic MathRepresent the function f x Find the following coefficients Co C1 C2 C3 11 CA Find the radius of convergence R M 4 1 8x as a power series f x n 0 Cnx

Math - Others
FunctionsPart 1 of 2 a What value is 1 5 standard deviations below the mean The value that is 1 5 standard deviations below the mean is 28 Part 1 2 Part 2 of 2 b What values are 1 standard deviations from the mean The values that are standan aviations from 3 C X

Math - Others
Basic MathWhat is your approximate self imposed credit limit each month for credit card purchases Why did you choose this amount Even if you don t have a credit card think of an amount that you would impose when you do own a credit card

Math - Others
Linear AlgebraSparkle Cleaners uses of a jug of window cleaner in 3 weeks How much window cleaner do they use in 1 week Simplify your answer and write it as a proper fraction mixed number or whole number

Math - Others
Mathematical ReasoningTAsk Bing Al 6 The table below provides predicted population data about the world and India Predicted Population millions 2050 Region World India AND 2030 8460 1 m 1 438 5 a What percent of the world population is predicted to live in India in 2030 Round your result to one decimal place 4 c Calculate the absolute change in the predicted population of India between 2030 and 2050 Round your result to one decimal place Use the predicted populations from the table not the percentages of the world population that you calculated in parts a b 3 5 of 6 D 1 9 131 6 1468 1 b What percent of the world population is predicted to live in India in 2050 Round your result to one decimal place 4 d Calculate the absolute change in the percent of the world population that lives in India between 2030 and 2050 Round your result to one decimal place Use the percentages of the world population that you calculated in parts a b not the predicted populations from the table 3

Math - Others
Trigonometric equationsBernoulli Equations The equation dy dx 2y xy is an example of a Bernoulli equation 1 Show that the substitution v y reduces equation 1 to the equation dv dt 2 Solve equation 2 for v Then make the substitution v y to obtain the solution to equation 6v 3x

Math - Others
Basic MathThe graph below shows the supply and demand curves for regular unleaded gasoline in a medium sized city with the equilibrium price and quantity indicated Adjust the price by dragging the horizontal line up or down so there is a daily surplus of 40 000 gallons To refer to the graphing tutorial for this question type please click here Price per gallon 8 7 5 7 6 5 6 5 5 5 4 5 4 3 5 3 2 5 2 1 5 1 0 5 0 4 0 20 6 OP of D 8 8 8 8 6 3 3 3 3 3 Quantity thousands of

Math - Others
Mathematical ReasoningSide College freshmen involved in a dating relationship agreed to participate in a nine month long study Every two weeks participants answered a detailed questionnaire about their relationship and their emotional well being Over the course of the study 26 of the participants experienced a breakup The average distress of these 26 participants at the time of breakup 0 weeks and over the following 10 weeks was assessed from their questionnaire answers The table shows the findings in a scientific publication Time since brea kup wee ks Aver age distr ess unit less score 0 2 6 10 3 3 3 1 2 9 6 2 6 CSV Excel JMP Mac TXT Minitab14 18 Minitab 18 PC TXT R SPSS TI CrunchIt P Eastwick et al Mispredicting distress following romantic breakup Revealing the time course of the affective forecasting error Journal of Experimental Social Psychology 44 2008 pp 800 807 doi 10 1016 j jesp 2007 07 001 Macmillan Learning Each value of y in the data table represents the average emotional distress of 26 individuals at a specific time after breakup If the published findings had included the distress values of all 26 participants rather than their average would the corresponding scatterplot have shown ore or less scatter The scatterplot using the individual 26 values rather than average values for each specified time would have How would this affect the value of the correlation r Explain your reasoning The correlation would likely be less in strength because individual values have more variability than averages The correlation would likely be close to 0 because increasing the sample size always decreaases the correlation The correlation would likely not change because corerlation is not a complete summary of two variable data even after you have established that the relationship between the variables is linear The correlation would likely be even stronger because correlation calculated from averaged data is typically much strong than correlation calculated from raw individual data points

Math - Others
Linear AlgebraPrice dollars per arrow 150 28 2288 228 140 1 30 120 110 100 90 80 Using the point plotting tool interpret the demand schedule to plot five points on Oliver and Malcolm s combined demand curve Then use the straight line tool to draw the demand curve that connects them Use a single line not multiple segments To refer to the graphing tutorial for this question type please click here 50 588 88 40 30 10 0 8 arrow 30 OF g 140 90 60 30 0 AND 100 week 0 20 40 60 80 66 85 8 Market demand arrows per week arrows per week 0 30 40 50 60

Math - Others
Basic MathEvery Saturday I go to my local downtown market to buy fresh vegetables and bread My market is somewhat unusual because everything is sold through an auction an auctioneer calls out a price buyers yell out how much they want to buy and sellers yell out how much they want to sell If there s a match the goods are sold at that price If not the auctioneer has to call out a new price until there is a match Let s look at an auction for banana bread There are 20 buyers and 4 sellers of banana bread The table below provides information for a single buyer s demand curve and a single seller s demand curve Price 10 8 6 4 2 Quantity of banana bread demanded by one buyer 0 2 4 6 8 Quantity of banana bread supplied by one seller 60 50 40 30 20

Math - Others
Basic MathRqmts Design 6 17 50 25 5 17 1 83 3 35 to 0 7 1 33 1 77 Code B 10 33 24 Code C 3 33 83 69 Integ 8 67 45 Te 2 33 a The client has asked for an estimated completion date b The client would like to have the completed software in 37 weeks What is the likelihood that the critical pat be completed in that time frame c The client has just asked if it would be possible to have the completed software in 36 weeks What is the likelihood the project will be completed in that timeframe d The client wants to know if it would be possible to complete the project in 33 weeks What is the probability meeting the client s demand

Math - Others
Basic MathOver the past 10 years the craft beer industry has grown tremendously Whether it is a byproduct of the buy local movement or because beer drinkers have become more refined more and more people are putting down their Bud Light and picking up a bottle o Sweet Baby Jesus or Blithering Idiot For each of the items to the right of the figure label where the new equilibrium will be relative to the original equilibrium E Price Craft Beer Market E D Quantity A More beer drinkers prefer craft beer over national brands B The price of hops a key ingredient in beer has risen The price of wine has fallen Despite the increase in the price of hops a key ingredient in beer sales of craft beer increase as beer drinkers switch from drinking national brande

Math - Others
Basic Mathrecent Baby Boom has caused an increase in population The graph below shows the market for diapers at equilibrium before the baby boom Using the drag tool drag the appropriate curve s to show the effect of the recent baby boom on the market for diapers To refer to the graphing tutorial for this question type please click here Price per box of diapers Part 2 1 point 4 O Quantity boxes of diapers What will happen to the price of a college education 18 years from now Choose one A The supply of a college education will increase causing a decrease in the price B The demand for a college education will decrease causing a decrease in the price See H
Math - Others
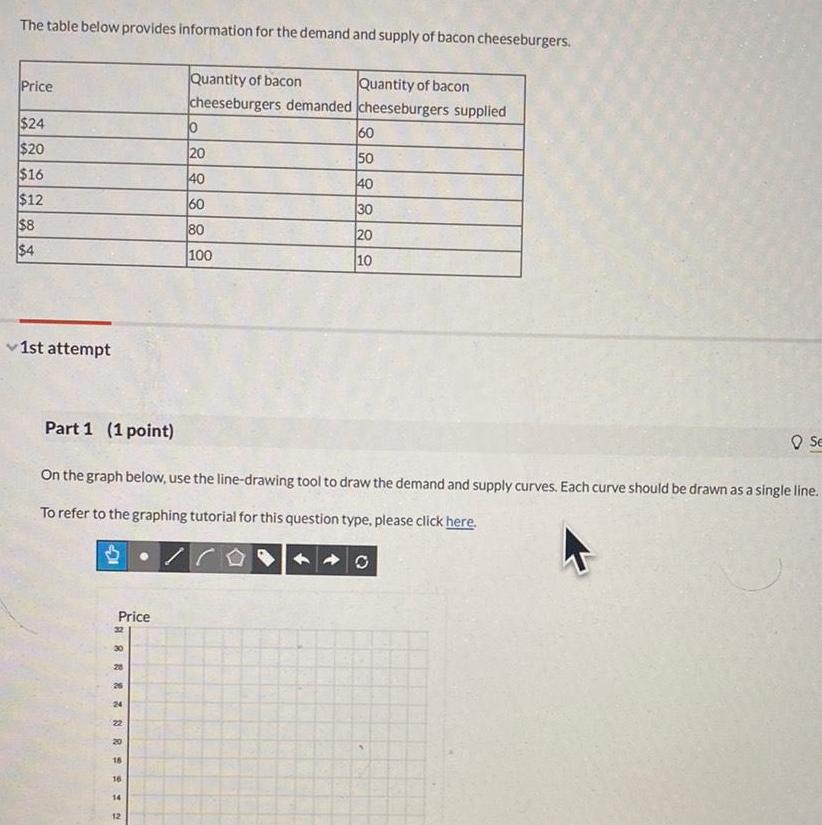
Basic MathThe table below provides information for the demand and supply of bacon cheeseburgers Price 24 20 16 12 8 4 1st attempt Price AR ZNR 2 2 30 Part 1 1 point On the graph below use the line drawing tool to draw the demand and supply curves Each curve should be drawn as a single line To refer to the graphing tutorial for this question type please click here 24 22 16 16 14 Quantity of bacon Quantity of bacon cheeseburgers demanded cheeseburgers supplied 12 0 20 40 60 80 100 60 50 40 30 20 10 O Se

Math - Others
Basic MathSuppose that Sony decides to decrease the price of the PlayStation 4 video game system for which there are many games available Based on Sony s decision what can we infer Choose one or more A The market demand for PlayStation 4 games will increase B The quantity of PlayStation 4 video game systems demanded will increase OC The market demand for the PlayStation 4 video game systems will increase

Math - Others
Basic MathApple which makes the iPhone is forced to pay its workers higher wages ategories A celebrity who endorses Subway is arrested Shift in Demand A new report indicates that eating hot dogs can prevent cancer Nike s customers learn of Adidas decision to lower its prices Shift in Supply Neither

Math - Others
Basic MathYou publish a magazine for calculator collectors To produce and distribute this magazine you use a number of inputs computers labor paper postage staplers What is the impact on the market if the price of paper goes up Choose one A The demand for the magazine does not change and the supply curve shifts to the right The equilibrium price falls but the equilibrium quantity rises B The demand for the magazine does not change and the supply curve shifts to the left The equilibrium price rises but the equilibrium quantity falls C The demand for the magazine shifts to the left and the supply curve shifts to the right The equilibrium price falls but there is an unknown change in the equilibrium quantity D The demand for the magazine shifts to the right and the supply curve shifts to the left The equilibrium price rises but there is an unknown change in the equilibrium quantity

Math - Others
Basic MathThe market for tablet computers contains only a few major producers If more tablet computer producers enter the market what will happen Choose one or more A The market will become more competitive and the price will fall B Individual sellers will have more control over the market C There will be a greater quantity of tablet computers available in the market D The market will become more competitive and the price will rise

Math - Others
Basic MathThe black capped chickadee Poecile atricapilla is a small songbird commonly found in the northern United States and Canada Chickadees often live in cooperative flocks using a complex language to communicate about food sources and predator threats In an experiment researchers recorded chickadee vocalizations in an aviary when the birds were presented with predators of various sizes The table contains data that represent the average number of D notes per chickadee warning call for each type of predator along with the predator wingspan in centimeters Predator Pygmy owl Saw whet owl Kestrel Merlin Cooper s Hawk Short eared owl Prairie falcon Gyrfalcon Peregrine falcon Red tailed hawk Great horned owl Great gray owl Rough legged hawk Predator wingspa n cm 31 2 38 8 57 6 60 6 80 6 89 2 109 9 115 1 120 0 120 0 120 4 132 2 138 0 Number of D notes per call 3 96 4 09 2 76 3 04 3 18 2 28 2 20 2 25 2 80 2 56 2 46 2 06 1 36 To access the complete data set click the link for your preferred software format CSV Excel JMP Mac TXT Minitab14 18 Minitab18 PC TXT R SPSS TI CrunchIt 1 C N Templeton E Greene and K Davis Allometry of alarm calls black capped chickadees encode information about predator size Science 308 2005 pp 1934 1937 O Macmillan Learning Plot the number of D notes per call response variable against the predator wingspan explanatory variable Choose the correct scatterplot Scatteplot of Number of 0 retes per cal vs Predator wingipan o Pa Scatteplot of Namber of D notes per call vs Predator wingspanjo Prawn Scept of Number of Dnatas per cal vs Predator wingioon jum Pa Scaterpol of Number of D netes per cal vs Predar wingipan janj G

Math - Others
Basic Mathmework A news item is spread by word of mouth to a potential audience of 6 000 people The following function models the number of people who have heard the news after t days Complete parts a through g below 6 000 1 70e f t 0 3t Part 1 of 7 a Approximately how many people will have heard the news after 12 days Round to the nearest hundred as needed CDB Ay 6000 4000 2000 0 0 5 10 15 20 25 30 graph of f Q Q Ay 500 2 300 100 0 5 10 15 20 25 30 graph of f Q G

Math - Others
Mathematical Reasoningd Find an equation of the plane that passes through 2 7 2 and is perpendicular to the line with parametric form 1 2t t 3t 12


Math - Others
Basic MathSuppose the cost to the firm of shipping cars falls Using shipping costs will affect the market To refer to the graphing tutorial for this question type please click here Price O 02

Math - Others
Basic Mathor 1 10 determine if set is a domain 1 Im z 2 Im z i Re z 4 3i z 2 2i 2 Re z 2 2 3 4

Math - Others
Trigonometry19 Distance between Two Docks Two docks are located on an east west line 2587 ft apart From dock A the bearing of a coral reef is 58 22 From dock B the bearing of the coral reef is 328 22 Find the distance from dock A to the coral reef

Math - Others
Basic Math23 Flying Distance The bearing from A to C is S 52 E The bearing from A to B is N 84 E The bearing from B to C is S 38 W A plane flying at 250 mph takes 2 4 hr to go from A to B Find the distance from A to C

Math - Others
Basic MathEnter the answer to each question in base 10 a If a positive integer written in base 10 has 4 digits what is the least the integer could be b If a positive integer written in binary has 6 digits what is the most the integer could be c If a positive integer has 8 digits when written in binary at most how many digits does it have when written in base 10 d Find the largest number whose binary representation is exactly 4 digits longer than its base 10 representation

Math - Others
Mathematical ReasoningLet A and B be sets and suppose that BCAN B holds Select all of the statements that are guaranteed to be true OA AUB A OB An B B OC A B A B OD BCA DE BCA OF A B AUB OG AnB 0 OH An BC A

Math - Others
Functions21 Distance between Two Ships A ship leaves its home port and sails on a bearing of S 61 50 E Another ship leaves the same port at the same time and sails on a bear ing of N 28 10 E If the first ship sails at 24 0 mph and the second sails at 28 0 mph find the distance between the two ships after 4 hr WA N 28 10 61 50 1 I E


Math - Others
Sets and RelationsSuppose that subsets of the universe U 1 2 3 4 5 6 7 8 9 10 are encoded by 0 1 bit strings where a 1 in the ith position indicates membership of the ith th element of U 1 Which bit string encodes the subset 2 4 6 8 10 2 To which subset of U does the string 1000000001 correspond 3 To which subset of U does the string 0100111010 correspond 4 Which bit string encodes the subset

Math - Others
Sets and RelationsRecall the following fact given in class Fact Let S be a finite set with S n Then P S 22 Let S 1 2 3 4 5 6 7 8 9 a How many subsets does S have in total b How many subsets A of S satisfy the property that 2 3 4 5 6 7 8 9 A G Cak Hint It s easy to list all such subsets

Math - Others
Sets and RelationsLet A 0 3 6 and B 6 5 4 3 6 7 a Compute the power set of A List the elements of the power set separated by commas Answer P A b Compute A x B

Math - Others
Sets and RelationsLet A and B be subsets of a universe U On each line put a checkmark if and only if the statement is true OA If U is infinite and Ac is finite then A is infinite OB If A is infinite and U is infinite then A is finite OC If A is infinite and B is finite then AUB is infinite OD If A is finite and B is finite then AUB is finite E If A is infinite then A B is infinite E If A is infinite and B is infinite then An B is infinite

Math - Others
Sets and RelationsLet A 2 5 11 and B 10 22 55 Give the elements of the following set S a b E A x B b is a multiple of a List the elements separated by commas Answer S B

Math - Others
Basic MathLet B 2 5 Compute the power set of B P B Hint Enter the elements of the power set as a list separated by commas Also remember that each element of power set of Bi a set The empty set can be entered as

Math - Others
Simple & Compound InterestAnalysis 01 Assume that you have 1 000 to invest so insert 1000 as your Present Value in the table below 1 Assume that you want to invest your money for 5 years insert 5 for Number of Periods Assume an 2 annual interest rate of 3 00 insert 3 for Interest Rate Per Period The table below will determine the 3 Future Value of your investment If you input the numbers correctly your Future Value is computed to be 1 159 which is what your investment will be worth in 5 years Now revise the input to reflect your 5 actual savings and the prevailing interest rate so that you can see how your savings will grow in 5 years Even if you have no savings now you can at least see how the interest rate affects the future value of savings by revising your input in the Interest Rate per Period and then notice the change in the Future Value Future Value of a Present Amount Present Value Number of Periods Interest Rate per Period Future Value

Math - Others
FunctionsHence from 1 the d c s of the line are a b C a b c a b c a b c where depending on the desired sign of k either a positive or a negative sign is to be taken for 1 m and n For any line if a b c are direction ratios of a line then ka kb kc k 0 is also a set of direction ratios So any two sets of direction ratios of a line are also proportional Also for any line there are infinitely many sets of direction ratios 1 t 11 2 1 Direction cosines of a line passing through two points Since one and only one line passes through two given points we can determine the direction cosines of a line passing through the given points P x y z and Q x Z as follows Fig 11 2 a J Therefore Let 1 m n be the direction cosines with the x y and z axis respectively 380 where m t cos y Draw perpendiculars from P and Q to XY plane to meet at R and S Draw a perpendicular from P to QS to meet at N Now in right angle triangle PNQ ZPQN Y Fig 11 2 b cos MATHEMATICS 200 CERT NO PQ n t 1 17 PQ PQ Similarly and cos Hence the direction cosines of the line segment joining the points P x y z and Q x y z are b of the line PQ and let it makes angles a and y N X PQ be repy fish Rationalised 2023 24 Q X X 3 3 2 2 PQ PQ PQ PQ x x 1 3 Note The direction ratios of the line segment joining P x y z and Q x may be taken as X X Y Y 2 z or x x 2 2 Example 1 If a line makes angle 90 60 and 30 with the positive direction of x y and z axis respectively find its direction cosines I Solution Let the d c s of the lines be 1 m n Then cos 90 0 m cos 60 2 3

Math - Others
FunctionsA closed piston cylinder device contains 0 2 kg of air initially at 300 K and 100 kPa The air is now slowly compressed in an isothermal process to a final pressure of 250 kPa Assume the air is an ideal gas with constant specific heat Cp 1 004 kJ kg K Cv 0 717 kJ kg K The molecular weight for air is 29 kg kmol A Draw a schematic and list the necessary assumptions B Determine the volume in m of the air at the initial state C Determine the temperature and volume of the air at the final state D Determine the work in kJ during the process Is the work done by the air or on the air F Determine the heat transfer in k I during the process is a heat input or output

Math - Others
FunctionsHydrogen is contained in a rigid tank 5 m at an initial pressure of 150 kPa Hea transfers from the tank causing the temperature to decrease from 327 C to 27 C Assume constant specific heats at the average temperature a The final pressure in the tank is A 7 kPa B 12 kPa C 75 kPa D 137 kPa b The amount of heat transfer is A 943 6 kJ B 1318 6 kJ C 1731 4 kJ D 3113 1 kJ

Math - Others
Basic MathProblem 7 10 pts Pure substance in connecting tanks Two rigid tanks are connected by a valve as shown in the figure below Tank A contains 0 25 m of water at 400 kPa and 75 percent quality Tank B contains 0 6 m of water at 200 kPa and 250 C Next the valve is opened and the two tanks eventually come to the same state Determine the pressure and the amount of heat transfer when the system reaches thermal equilibrium with the surroundings at 35 C In your solution start with a schematic that includes the boundary of the system that you will use and list all your relevant assumptions H O 400 kPa H O 200 kPa