Basic Math Questions and Answers

Math - Others
Basic MathA single fair die is rolled twice a Determine the number of points in the sample space b Construct a tree diagram and determine the sample space Determine the probability that a double a 1 1 or 2 2 etc is rolled Determine the probability that a sum of 11 is rolled Determine the probability that a sum of 8 is rolled Are you as likely to roll a sum of 11 as you are of rolling a sum of 8 a There are points in the sample space b Construct a tree diagram Choose the correct answer below OClick here to view choice d OClick here to view choice c O Click here to view choice b Click here to view choice a What is the sample space Choose the correct answer below GOD OA 11 12 13 14 15 16 21 22 23 24 25 26 31 32 33 34 35 36 41 42 43 44 45 46 51 52 53 54 55 56 61 62 63 OB 12 13 14 15 16 21 23 24 25 26 31 32 34 35 36 41 42 43 45 46 51 52 53 54 56 61 62 63 64 65 OC 11 12 13 14 15 16 21 22 23 24 25 26 31 32 33 34 35 36 OD 11 13 15 22 24 26 31 33 35 42 44 46 51 53 55 62 64 66 The probability that a double is rolled is Simplify your answer The probability that a sum of 11 is rolled is

Math - Others
Basic Math54 You decide to take a science course an English course and a mathematics course during the next term The available courses that you can take are listed in the table Complete parts a through e below Click here to view diagram b Click here to view diagram c O O Click here to view diagram d O Click here to view diagrama Describe the sample space Choose the correct answer below exa OORA ORT GCA GCT BRA BRT PCA PCT ORA ORT OCA OCT GRA GRT GCA GCT BRA BRT BCA BCT ORC ORT OAC OAT GRC GRT GAC GAT BRC BRT BAC BAT PRC PRT PAC PAT O ORA ORT OCA OCT GRA GRT GCA GCT BRA BRT BCA BCT PRA PRT PCA PCT c Determine the probability that oceanography is selected The probability is Simplify your answer d Determine the probability that algebra and biology are selected The probability is Simplify your answer e Determine the probability that geology is not selected Smeltin Science English Oceanography 0 Poetry R Mathematics Algebra A Composition C Trigonometry T Geology G Biology B Physics P

Math - Others
Basic Mathbility of selecting a monkey or a number greater than 3 is teger or a simplified fraction

Math - Others
Basic Mathindicated probability d B 0 4 P A 0 7 and 6 find P A or B P A or B Simplify your ar

Math - Others
Basic MathThere are distinct ways the two experiments can be performed together Do po Exce ISURA Woys vo w nowman
Math - Others
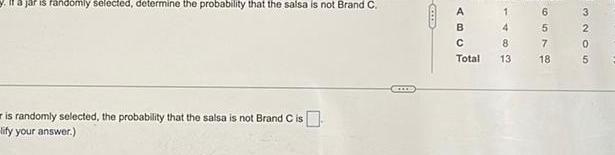
Basic Mathjar is randomly selected determine the probability that the salsa is not Brand C is randomly selected the probability that the salsa is not Brand C is lify your answer CELLES A B C Total 1483 6578 3NOS 2 0 5

Math - Others
Basic Matha If you randomly select one of the choices what is the probability that you select the correct choice b If you randomly select one of the choices what is the probability that you select an incorrect choice c If you can eliminate three of the eight choices and randomly select one of the remaining choices what is the probability that you select the correct ch d If you can eliminate three of the eight choices and randomly select one of the remaining choices what is the probability that you select an incorrect a P correct Type an integer or a simplified fraction b P incorrect Type an integer or a simplified fraction c P correct after elimination Type an integer or a simplified fraction d P incorrect after elimination Type an integer or a simplified fraction

Math - Others
Basic MathFor the Facebook data provided find the mean median and midrange for hours online week and number of friends in the sample using the appropriate Excel function or formulas Compare these measures of location Click the icon to view the data The mean for the number of hours online per week is 7 09 Type an integer or a decimal rounded to two decimal places as needed The median for the number of hours online per week is 6 Type an integer or a decimal rounded to two decimal places as needed The midrange for the number of hours online per week is 9 Type an integer or a decimal rounded to two decimal places as needed The mean for the number of friends is 188 10 Type an integer or a decimal rounded to two decimal places as needed The median for the number of friends is 120 Type an integer or a decimal rounded to two decimal places as needed The midrange for the number of friends is 275 Type an integer or a decimal rounded to two decimal places as needed Compare the measures of location for each data set In each case the is the lowest value while the is most susceptible to outliers while the is the highest This is because the is least susceptible to outliers 1 2 3 4 5 6 7 8 9 10 11 12 13 14 15 16 17 18 19 20 21 22 23 24 25 26 27 28 29 30 Gender Hours online week Friends 1 female 2 male 3 female 4 female 5 female 6 male 7 male 8 female 9 female 10 female 11 male 12 male 13 female 14 female Student 15 female 16 female 17 male 18 female 19 male 20 female 21 male 7 15 10 13 12 11 5 9 9 6 4 5 3 4 5 6 4 5 6 4 6 90 500 400 110 380 450 250 260 100 240 50 70 50 150 70 80 120 60 150 280 90


Math - Others
Basic MathThe following table represents the highest educational attainment of all adult residents in a certain town If an adult is chosen randomly from the town what is the probability that they have a high school degree or some college but have no college degree Round your answer to the nearest thousandth High school only Some college Bachelor s degree Master s degree Total Age 20 29 Age 30 39 Age 40 49 Age 50 over Total 1156 976 1126 3658 1649 1352 4781 881 983 3848 598 2982 3909 15269 694 4380 400 810 828 576 2614 970 1156 1114 4366


Math - Others
Basic MathSolve the following Exact ODE 3 2 x dy da y 4 X 1 x 0 Y Here is the basic variable y x is a function of a Y

Math - Others
Basic Mathven m Zx 98 WZ YZ mZY 92 Find each measurement Y WX ZZ W Choose 0 Choose WZ ZW Choose Choose d the value of x Lines that appear to be tangent are tangent 12 12 P Z 9 Q

Math - Others
Basic MathA The accompanying dataset from a survey on a social networking website provides data gathered from a sample of college students Create a scatter diagram showing the relationship between hours online week and friends Friends should be on the x axis and hours online week on the y axis What conclusion can you reach Click the icon to view the data Hours online week A 16 Friends 600 Hours online week B 16 Choose the correct answer below H Friends 600 Hours online week C 167 of MER Friends 600 OD Hours online week 16 Friends OA As the number of friends increases it appears that the hours spent online relatively decreases OB As the number of friends increases it appears that the hours spent online relatively increases OC The hours spent online increases until the number of friends reaches greater than 20 and then the hours spent online levels off OD There is no relationship between the hours spent online and the number of friends 600 2 3 4 5 6 7 8 9 10 11 12 13 14 15 16 17 18 19 20 21 22 23 24 25 26 27 28 29 1 female 2 female 3 male 4 male 5 female 6 female 7 female 8 male 9 female 10 female 11 female 12 female 13 male 14 female 15 male 4 10 8 15 9 3 7 3 12 2 6 2 3 66 100 400 320 500 260 80 90 250 110 30 80 30 300 240 150

Math - Others
Basic MathDetermine the unknown side length in each of the following decimal place X 5 6 6 5 6 5 7 8 Question 2 1 point Determine the unknown side length in each of the following right triangle to no decimal places 9 6 7 447 6

Math - Others
Basic Mathtriangle AABC ZA 56 2C 63 and a 19 cm AND ANGLES 2 marks for each missing part Question 4 A flock of Canada geese are flying in a V formation that forms an angle of 68 The lead goose is 16 m from the last goose on the right and 21 m from the last goose on the left How far apart are the last two geese in the V formation 2 marks for sketch 2 marks for solve Question 5 Two cars leave Oshawa at the same time travelling on different roads Car A travels 50km and car B travels 45km At the end of the trip the two cars are 40km apart What is the angle between the two roads that the cars took leaving Oshawa 2 marks for sketch 2 marks for solve 153154

Math - Others
Basic MathA 15 View hint for Question 3 Question 4 3 points Determine the unknown angles in the following right triangle

Math - Others
Basic Math0 Reveals exceptional performance over and under performance on which to focus attention Analyzes the effectiveness of the recommended actions and feeds the decisions back to the operational systems and data warehouse against which Publish reports stage reporting will be conducted thereby closing the loop Seeks to understand the root causes behind the identified exceptions Provides standard operational and managerial 1 Publish reports 2 Identify exceptions 3 Determine causal factors 4 Model alternatives 5 Track actions

Math - Others
Basic MathAn exponential sequence G P has a positive common ratio If the sum to infinity of the sequence is 25 and the sum of the first 2 terms is 16 find the a fifth term b sum of the first 4 terms of the sequence

Math - Others
Basic MathA fis continuous lim f x does not exist X 5 For each given x value use the figure to determine whether the function is continuous or discontinuous at that x value If the function is discontinuous state which of the three conditions that define continuity is not satisfied Select all that apply a x 5 f 5 does not exist f x f 5 sull b x 2 Ofis continuous X lim f x does not exist X 2 f 2 does not exist lim f x f 2 y f x 2 4 V

Math - Others
Basic MathConsider the following p q 2q 9 3 a Find the derivative by using the definition p q b Find the instantaneous rate of change of the function at any value p q Find the instantaneous rate of change of the function at the value q 11 p 11 c Find the slope of the tangent at the value q 11

Math - Others
Basic Matha b c 3 A 9 6 3 y f x lim f x X C lim f x x ct lim f x d f c X C X In the lithit is infinite enter o or co as appropriate If the limit does not otherwise exist en

Math - Others
Basic MathFor the given function find the average rate of change over each specified interval f x x x 12 a 0 2 b 4 10


Math - Others
Basic MathSuppose that the average number of minutes M that it takes a new employee to assemble one unit of a product is given by 38 33t 2t 7 where it is the number of days on the job M a Is this function continuous for all values of t Yes this function is continuous for all values of t O No this function is not continuous for all values of t Excellent b Is this function continuous at t 18 O Yes this function is continuous at t 18 No this function is not continuous at t 18 Nice job c Is this function continuous for all t 0 O Yes this function is continuous for all t 0 No this function is not continuous for all t 0 Nice job d What is the domain for this application Enter your answer using interval notation

Math - Others
Basic MathLet f x 3x2 2x a Use the definition of derivative and the Procedure Example box in this section to find the derivative b Find the instantaneous rate of change of f x at x 1 c Find the slope of the tangent to the graph of y f x at x 1 d Find the point on the graph of y f x at x 1
Math - Others
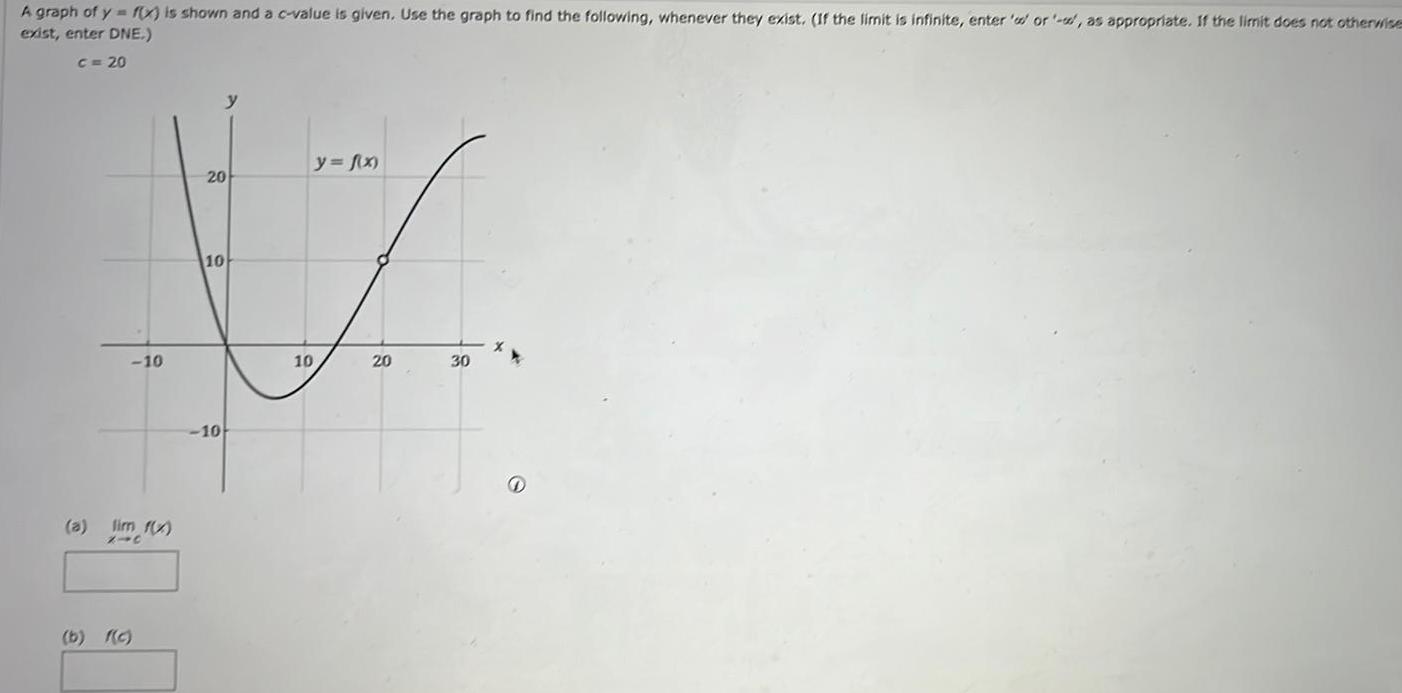
Basic MathA graph of y f x is shown and a c value is given Use the graph to find the following whenever they exist If the limit is infinite enter or as appropriate If the limit does not otherwise exist enter DNE C 20 y f x 20 V 10 10 20 10 a lim f x b f c y 10 30

Math - Others
Basic MathComplete the table and predict the limit if it exists Round your answers to three decimal places If the limit is infinite enter o or as appropriate If the limit does not otherwise exist enter DNE f x 5 9 lim f x X 6 5 99 5 999 6 001 6 01 6 1 54 3x x x 6 f x

Math - Others
Basic MathFirst Order ODE General Solution Initial Value Problem Solve the initial value problem y y tan x sin 2x y 0 1

Math - Others
Basic Mathnd the first second and third quartiles for the sales amounts in the data provided and interpret the results Click the icon to view the data e first quartile is meaning that of the sales amounts are less than this value ound to two decimal places as needed 2 East 3 West 4 North 5 West 6 South 7 West 8 East 9 West 10 West 11 South 12 South 13 East 14 North 15 East 16 West 17 West 18 West 19 West 20 West 21 West 22 North 23 West 24 South 25 West 26 West 27 West 28 West 29 South 30 East Paypal Credit Credit Paypal Credit Paypal Credit Credit Paypal Paypal Paypal Credit Paypal Credit Credit Paypal Credit Paypal Credit Credit Paypal Credit Credit Credit Paypal Credit Credit Credit Paypal Sourc 93816545 Web 74083490 Web 64942368 Web 70560957 Email 35208817 Web 20978903 Email 80103311 Web 14132683 Web 40128225 Web 49073721 Web 57398827 Email 34400661 Web 54242587 Web 62597750 Web 51555882 Web 54332964 Web 26623353 Email 78594431 Web 89385348 Web 69868417 Web 59660276 Email 25456590 Web 93283893 Email 45991123 Web 79121745 Email 80685117 Email 56686474 Web 25270813 Web 59736137 Web Amount Product 20 55 DVD 17 24 DVD 24 29 DVD 23 93 Book 15 45 Book 18 26 DVD 178 25 Book 20 41 Book 16 83 DVD 24 76 DVD 22 48 Book 19 97 Book 21 31 DVD 164 03 Book 20 44 DVD 24 09 DVD 18 45 Book 19 64 Book 18 55 DVD 17 63 DVD 18 69 Book 217 41 Book 16 38 Book 19 11 DVD 22 22 DVD 23 56 DVD 15 33 DVD 20 02 Book 17 52 DVD Time of Day 22 19 13 27 14 27 15 38 15 21 13 11 21 59 4 04 19 35 13 26 14 17 1 01 10 04 9 09 5 05 20 29 15 03 18 54 20 00 12 37 5 05 20 42 10 12 16 27 20 22 19 58 19 44 19 28 15 48

Math - Others
Basic MathState the linear programming problem A breed of cattle needs at least 10 grams of protein and at least 9 grams of fat per day These nutrients come from food A and food B Food A provides 5 grams of protein and 2 grams of fat and costs 3 per unit Food B provides 2 grams of protein and 4 grams of fat and costs 2 per unit How much of each food must be bought to obtain the minimum cost per serving Let x be the amount of food A needed and y be the amount of food B needed O Minimize z 2x 3y subject to 5x 2y 10 2x 4y 29 x 20 y 20 Minimize z 3x 2y subject to 5x 2y 10 2x 4y 9 x20 y 20 O Minimize z 3x 2y subject to 2x 4y 10 5x 2y 29 x 20 y 20 O Minimize z 3x 2y Subject to 5x 2y 10 2x 4y z 9 x 20 y20

Math - Others
Basic MathUse a Pivot Table to construct a cross tabulation for Marital Status and Housing Type for the data provided Click the icon to view the Marital Status and Housing Type data Complete the cross tabulation for Marital Status vs Housing Type Type whole numbers Marital Status vs Housing Type Column Labels Own Count Row Labels Other Divorced Married Single 10 Grand Total 14 4 10 22 11 43 76 Rent 12 2 14 Grand Total 38 13 53 104 4 Divorced 5 Single 6 Single 7 Divorced 8 Single 9 Married 10 Married 11 Divorced 12 Divorced 13 Single 14 Single 15 Divorced 16 Single 17 Divorced 18 Single 19 Single 20 Divorced 21 Divorced 22 Single 23 Single 24 Divorced 25 Divorced 26 Single 27 Divorced 28 Divorced 29 Married 30 Single 31 Divorced 32 Divorced 33 Single 34 Divorced 35 Married 36 Single 37 Single 38 Single 39 Single 40 Married Rent Own Own Rent Own Own Rent Own Own Own Own Own Other Own Other Own Rent Own Own Own Own Rent Own Other Own Own Own Own Own Own Rent Own Own Own Own Own Own 2 31 4 1 2 1 2 4 4 2 4 1 4 3 2 4 2 2 1 4 4 4 4 4 1 1 4 1 2 2 3 3 1 2 2 4

Math - Others
Basic MathRead the feasible maximum solution using the given final simplex table X1 X2 s1 s2 3 z 1 1 1 0 0 0 12 30 2 1 0 0 20 1 0 2 0 1 0 18 2 0 3 0 0 1 32 O x1 0 x2 12 S 20 S2 0 3 18 z 32 O x1 0 X2 12 S 0 2 20 S53 18 z 32 O x 12 x2 0 0 2 32 S3 18 z 20 O x 18 X2 0 1 0 S2 20 3 12 z 32

Math - Others
Basic Math7 42 1 5 Wis 1 5 a The zeros of f x are x separate by commas and Find the following information pertaining to the polynomial f x graphed above the zero x multiplicity the zero x multiplicity the zero x multiplicity the zero x multiplicity and the zero x has has has has LTE has multiplicity b The degree of f x is c The leading coefficient of f x is 5

Math - Others
Basic Math5 Solve for the missing side lengths using the Pythagorean Theorem a b X A 5 13 6 For the following diagrams calculate the length of AB A 6 m 3 m X 9 m B 16 8

Math - Others
Basic Mathraw BMD of the following bending member by referring SFD Specify the maximum bending moment of the member 14 kN A A 2 m 15 kN X 2 m 14 kN 04 PROB 15 Copyright 2015 rearson Efication allognes Reserved 1 kN 4 m 13 kN 20 kN m B

Math - Others
Basic Mathb Sketch SFD and BMD of the beam Specify the maximum bending moment of the member A 500 lb C 200 lb 6 ft 4 ft4 ft Figure 04 P21 B D 6 ft 300 lb 2 ft E
Math - Others
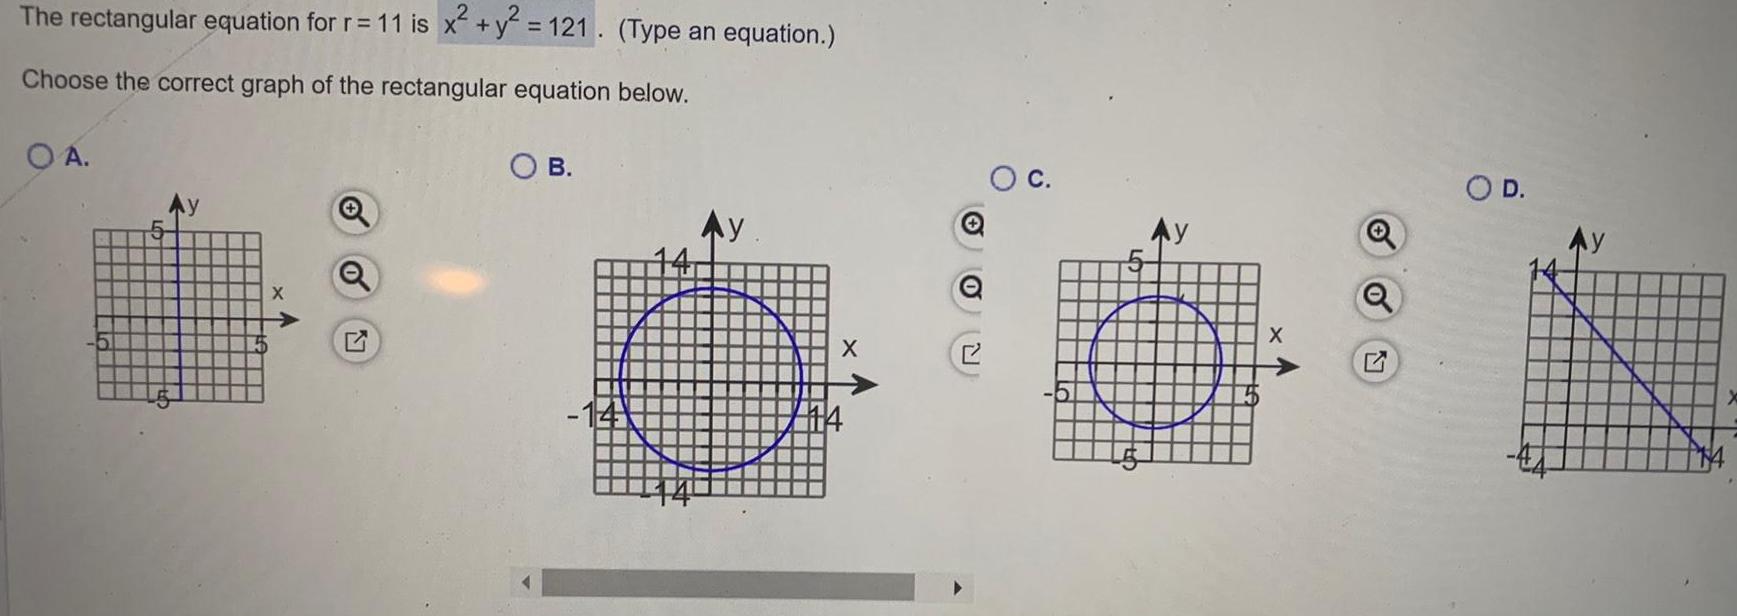
Basic MathThe rectangular equation for r 11 is x y 121 Type an equation Choose the correct graph of the rectangular equation below O A 5 5 X Q O B X X O D

Math - Others
Basic MathWrite the following complex number in rectangular form 8 cos 240 i sin 240 The rectangular form of 8 cos 240 isin 240 is Simplify your answer including any radicals Use integers or fractions for any numbers in the expression Rationalize all denominators Type your answer in

Math - Others
Basic MathThe equation x 3 3x 2 4 models the volume of a shipping container where x is the width Graph the equation to find the width of the box

Math - Others
Basic MathUse the drop down menus to identify the voice of each underlined verb Families reunite to eat a special New Year s Eve dinner Places are laid for family members who are absent Special foods that symbolize good luck are served Many people serve rice cakes called nian gao

Math - Others
Basic Math2 Find the solution set of the following system of linear equations represented by the augmented matrix 1 1 0 3 01 2 1 0 0 1 1

Math - Others
Basic MathWhich of the following is the integral calculation in the interval 0 2 1 4 using the Gregory Newton forward interpolation relation X 0 0 2 0 4 0 6 0 8 1 1 2 1 4 f x 0 0 92 1 36 0 84 1 12 5 11 28 20 44 8y 1 2 82y 0 92 0 44 0 52 1 96 3 88 6 28 9 16 0 48 0 96 1 44 1 92 2 4 2 88 8 y 1 2 0 48 0 2 7 0 24 5 0 92 44 91 0 48 51 04 0 48 0 48 0 48 0 48 0 48 0 2 6 0 92 18 0 44 27 0 96 24 0 48 0 2 7 0 92 24 5 0 44 44 91 0 96 51 04 0 48 0 2 6 0 18 0 92 27 0 48 24 0 48 64 y 0 0 0 0


Math - Others
Basic MathUse a PivotTable to construct a cross tabulation for Marital Status and Housing Type for the data provided Click the icon to view the Marital Status and Housing Type data Complete the cross tabulation for Marital Status vs Housing Type Type whole numbers Marital Status vs Housing Type Column Labels Own Count Row Labels Other Divorced Married Single Grand Total CO Rent Grand Total 3 Single 4 Divorced 5 Single 6 Single 7 Divorced 8 Single 9 Married 10 Married 11 Divorced 12 Divorced 13 Single 14 Single 15 Divorced 16 Single 17 Divorced 18 Single 19 Single 20 Divorced 21 Divorced 22 Single 23 Single 24 Divorced 25 Divorced 26 Single 27 Divorced 28 Divorced 29 Married 30 Single 31 Divorced 32 Divorced 33 Single 34 Divorced 35 Married 36 Single 37 Single 38 Single 39 Single Other Rent Own Own Rent Own Own Rent Own Own Own Own Own Other Own lother Own Rent Own Own Own Own Rent Own Other Own Own Own Own Own Own Rent Own Own Own Own Own 2 3 4 1 2 1 2 4 4 2 4 1 4 3 2 4 2 2 1 4 4 4 4 4 1 1 4 1 2 2 3 3 1 2 2 4

Math - Others
Basic MathApply three different colors of data bars to lunch dinner and delivery sales in the restaurant sales data provided to visualize the relative amounts of sales Then sort the data by the day of the week beginning on Sunday Compare the nonsorted data with the sorted data as to the information content of the visualizations Click the icon to view the restaurant sales data Apply three different colors of data bars to lunch dinner and delivery sales in the restaurant sales data provided to visualize the relative amounts of sales Choose the correct set of data bars for the lunch sales below OA Lunch Sales S 468 1345 xample 646 782 805 1289 1652 1209 579 664 891 1178 1581 1137 572 OB Get more help Lunch Sales 541 872 288 353 402 441 448 696 306 386 411 507 502 740 297 O C Lunch Sales 72 696 740 845 778 288 306 297 232 353 386 418 340 402 411 O D Lunch Sales 85 490 322 290 277 1243 783 342 329 302 244 1069 715 327 366 1 2 3 4 5 6 7 8 9 10 11 12 13 14 15 16 17 18 19 20 21 22 23 24 25 26 27 28 29 A Date B Day 1 Saturday 2 Sunday 4 Tuesday 5 Wednesday 6 Thursday 7 Friday 8 Saturday 9 Sunday 11 Tuesday 12 Wednesday 13 Thursday 14 Friday 15 Saturday 16 Sunday 18 Tuesday 19 Wednesday 20 Thursday 21 Friday 22 Saturday 23 Sunday 25 Tuesday 26 Wednesday 27 Thursday 28 Friday 29 Saturday 30 Sunday C Lunch Sales 541 872 288 353 402 441 448 696 306 386 411 507 502 740 297 418 344 466 621 845 232 340 425 378 591 778 D E Dinner Sales Delivery Sales 1468 1345 885 490 646 322 782 290 805 277 1243 783 342 329 302 244 1069 715 327 1289 1652 1209 579 664 891 1178 1581 1137 572 621 913 1332 1732 1324 523 731 940 1409 1856 1229 366 279 295 1255 637 320 412 244 351 1144 602 399 F

Math - Others
Basic MathA marketing researcher surveyed 100 individuals asking them if they liked a new product concept or not The results are shown in the accompanying table Convert the data into percentages for each gen class Then construct a chart of the counts and a chart of the percentages Discuss what each conveys visually and how the different charts may lead to different interpretations of the data Click the icon to view the survey data Convert the data into percentages for each gender class Type integers or decimals rounded to the nearest tenth as needed No Yes 1 196 Male Female 1 70 Survey data Male Female Yes 28 13 No 46 13 D X

Math - Others
Basic Math5 For the function complete the chart and sketch a possible graph of the function labelling key points App Degree f x x 1 x 3 x 2 Leading Coefficient End Behaviour x intercepts y intercept

Math - Others
Basic Math3 Complete the following table K Graph 60 40 20 88 Sign of Leading Coefficient Even or Odd Degree End Behaviour Symmetry Number of turning points Number of x intercepts Leas Possit Degra