Statistics Questions
The best high school and college tutors are just a click away, 24×7! Pick a subject, ask a question, and get a detailed, handwritten solution personalized for you in minutes. We cover Math, Physics, Chemistry & Biology.

Statistics
Statisticselp your work or conclusions in some way Describe what variable would be tested ar what would be your guess of the value of that variable Then include how the result if the null were rejected or not might change your conclusions or actions in some way Follow Up Post Instructions Respond to at least one peer Further the dialogue by providing more information and clarification Writing Requirements

Statistics
StatisticsWhich of the following results in a null hypothesis 7 and alternative hypothesis 7 Select the correct answer below O A study wants to show that the mean number of hours of sleep the average person gets each day is at least 7 O A study wants to show that the mean number of hours of sleep the average person gets each day is 7 OA study wants to show that the mean number of hours of sleep the average person gets each day is more tha O A study wants to show that the mean number of hours of sleep the average person gets each day is at most 7

Statistics
ProbabilityFor questions 9 10 use the spinner at the right The spinner is spun twice Find each probability 1 2 O 1 3 1 4 O 1 8 O 1 16 O 1 32 O 1 64 Bewing forms gle W7GimEN P I then 3 4 3 H 1

Statistics
ProbabilityOne marble is randomly selected from the jar at the right then NOT REPLACED and a second marble is selected Find the following probabilities O 1 49 O2 49 3 49 O 6 49 O 1 77 O 1 14 P Blue then Orange

Statistics
ProbabilityIf the spinner below is spun find each probability O 1 8 O 1 4 O 3 8 O 1 2 5 8 Landing on an even number


Statistics
ProbabilityA bucket of golf balls contains 8 white balls 2 purple balls 5 green balls and 11 red balls 00 5 13 O 6 13 O 7 13 O8 13 O9 13 O 10 13 O 11 13 Find the probability of selecting a black ball

Statistics
ProbabilityA bag of m m s contains 7 red 10 blue 5 brown 4 Green and 9 orange If one m m is selected at random find the following probabilities Express your answer as a fraction in lowest terms O 1 7 2 7 O 3 7 O4 7 1 5 2 5 3 5 Find the probability of selecting a blue m m Option 8

Statistics
Statistics3 st Quatile 11 median 13 Third Quartile 16 MAX VAI 17 11 13 16 23 S 4 upper Ferce Based on the box and whisker plot from the solution Above what is the range of data

Statistics
StatisticsA data set lists the number of times each person laughed during a comedy playing in a movie theater For this data set the minimum is 3 the first quartile is 11 the median is 13 the third quartile is 16 and the maximum is 17 Construct a box and whisker plot that shows the number of laughs Begin by first placing the middle dot on the median Then work on placing the rest of the points starting with the ones closest to the median Provide your answer below

Statistics
StatisticsThe data set below contains the average low temperatures in April for 9 Alaskan cities What is the interquartile range of this data set 5 12 14 19 19 21 25 29 33 Provide your answer below

Statistics
StatisticsIn an article regarding children who were raised by their grandparents a researcher conside the rates of children under 18 years of age living in California with grandparents as their primary caretakers The data set below includes a simple random sample of 12 percentages rounded to the nearest tenth from California counties of children under 18 living with grandparents Identify the potential outlier s if any 5 8 4 3 4 0 5 7 5 6 5 1 6 1 4 1 4 5 4 4 6 4 4 9 Select the correct answer below O There are no potential outliers O 6 4 is a potential outlier Both 4 0 and 6 4 are potential outliers 4 0 is a potential outlier E

Statistics
StatisticsSuppose a credit card company has a fraud detection Service that determines if a card has any Unusual Acturity The company maintains a data base of daily charges on a customers credit card The dataset below includes a daysworth of charges rounded to nearest dolla The customers is contacted to make sure that the credit card has not been compromised if a days worth of charges appears unusual In this case an unusual charge would be consider an outler Determine the amount the daily charges must exceed before the customer is contacted 153 89 31 174 99 47 121 95 178 137 10 154 90 109 126 Select All that Apply Daily charge that exceeds 248 is considered unusual Daily charge that exceeds 117 is considered unusual 3 DANly charge that exceeds 15 is considered Unvanl mak

Statistics
StatisticsGiven the following table data What is the potential outller Value 10 218 12 13 14 17 20 21 Frequency 1 1 H 4 6 2 3 Select correct Answer Below

Statistics
StatisticsThe U S Census Bureau frequently conducts nationwide surveys on the characteristics of U S households Suppose the following data are on the number of people per household for a sample of 20 households Find the five number summary for this data set by hand Report the five number summary in the following order Min Q1 Median Q2 Q3 Max Number of People 1 2 3 4 5 CO 6 7 Frequency 4 7 4 2 1 1 1

Statistics
StatisticsThe following data Set represents the amount Spont in billions of dollars each year on national defense by the U S government over the course of a 16 year period Find the five number Summary of this data set Round all answers to one decimal place 296 3 335 9 401 2 451 3 479 5 481 7 403 2 409 5 3bb 9 351 8 348 5 370 1473 8 546 4 574 6 675 1 Provide Answer Below Min Q1 Median 02 Q3 Max

Statistics
StatisticsSo the left end of the left whisker is the minimum value 1 the left edge of the box is the first quartile 11 the line in the middle of the box is the median 13 the right edge of the box is the third quartile 16 and the right end of the right whisker is the maximum value 17 Content attribution FEEDBACK Question Based on the box and whisker plot from the solution above what is the range of the data

Statistics
Probabilitysummarizes the number of working computers in household for a simple random sample of 19 households Find the five number summary Report the five number summary in the following order Min Q1 Median Q2 Q3 Max Number of Computers 0 1 2 3 4 5 Frequency 1 2 3 7 5 1

Statistics
Statisticsmonths For this data set the minimum is 1 the first quartile is 11 the median is 13 the third quartile is 16 and the maximum is 17 Construct a box and whisker plot that shows the number of reservations Begin by first placing the middle dot on the median Then work on placing the rest of the points starting with the ones closest to the median Provide your answer below

Statistics
StatisticsThe five number summary for a set of data is given below Min Q1 Median 55 61 76 What is the interquartile range of the set of data Select the correct answer below O 24 O 26 32 38 28 Q3 89 Max 95

Statistics
StatisticsWhat is the interquartile range of the set of data Select the correct answer below O24 26 32 38 28

Statistics
StatisticsSuppose a car salesman records the number of cars he sold for 15 weeks The following frequency rable summanzes the results What is the five number summary No of cars sold Frequency 1 W 10 11 2 8 1 3 ww 3

Statistics
StatisticsA data set lists the number of times each student raised their hand during an algebra class For this data set the minimum is 1 the first quartile is 8 the median is 10 the interquartile range is 3 and the maximum is 13 Construct a box and whisker plot that shows the number of times students raised their hand Begin by first placing the middle dot on the median Then work on placing the rest of the points starting with the ones closest to the median

Statistics
StatisticsA company is interested to know the variation in yearly sales amount for all 5 salespeople in the company The dataset shown below is the sales amount sold by the 5 salespeople in the company expressed in thousands of dollars Find the variance for this dataset Provide your answer below variance DE 40 60 65 70 80

Statistics
StatisticsWhich of the following lists of data has the smallest standard deviation Select the correct answer below O6 19 9 18 19 9 17 18 17 15 31 30 26 28 18 28 18 21 23 32 20 21 20 19 25 24 19 14 21 15 O 14 20 16 14 28 13 17 21 12 22 16 12 13 16 14 15 16 14 14 13

Statistics
StatisticsUsing the following set of data the same as in the previous problem find the sample standard deviation 4 5 8 12 9 10 The sample variance of this data set is 9 2 Round the final answer to one decimal place Provide your answer below 63 953 6 1993 06

Statistics
StatisticsFind the sample variance of the following set of data 4 5 8 12 9 10 Round the final answer to one decimal place Provide your answer below

Statistics
StatisticsThe following data values represent the daily amount spent by a family during a summer vacation Find the sample standard deviation of this dataset 96 125 80 110 75 100 121 Round the final answer to one decimal place Provide your answer below

Statistics
StatisticsThe data sets below include four random samples of size 8 that represent the age of the mother at the time of her first birth Which of the following data sets do you think will have the least variation Data Set A 23 25 24 34 31 28 24 37 Data Set B 18 39 20 23 23 20 33 32 Data Set C 26 37 29 39 34 29 35 32 Data Set D 34 29 32 38 38 37 36 35

Statistics
StatisticsIf the data is skewed or Symmetheal the following frequency table decide Value 4 IN ITO 6 8 9 10 11 13 14 15 16 Frequency 1 10 8 50 69 72 62 23 16 6 3 Select correct Answer The data are Skewed to the left The data are Skewed to the right Sumunstric

Statistics
ProbabilityThe Nielsen Company is an information data and market measurement firm that endeavors to provide its clients with valuable insights into consumer behavior and marketing information by collecting data that measures what consumers watch and what they buy For example the company publishes information on the TV viewing habits of Americans in the Nielsen Report on Television A random sample of 20 people yielded the weekly viewing times in hours which is shown in the data set below What is the interquartile range 27 68 22 32 40 37 28 36 29 33 34 32 32 15 36 33 45 7 18 23 Provide your answer below

Statistics
StatisticsC bigideasmath com MRL public app USING TOOLS Use the linear regression feature on a graphing calculator to find an equation of the line of best Ill correlation coefficient for the data Round all values to the nearest hundredth A 2 0 0 2 4 6x The equation of the line of best fit of the data is y The correlation coefficient is r Interpret the correlation coefficient O strong negative correlation O weak negative correlation O weak positive correlation O strong positive correlation

Statistics
Statisticsthe he following frequency table of data What is the potential outher Frequency 2 Value 16 11 19 18 19 22 320 20 21 22 23 24 25 26 27 28 29 13 5 Select correct Answer 2 81 PL 10 66 80 ac Pe 80 VocUZAA foorras Los 12 PL
Statistics
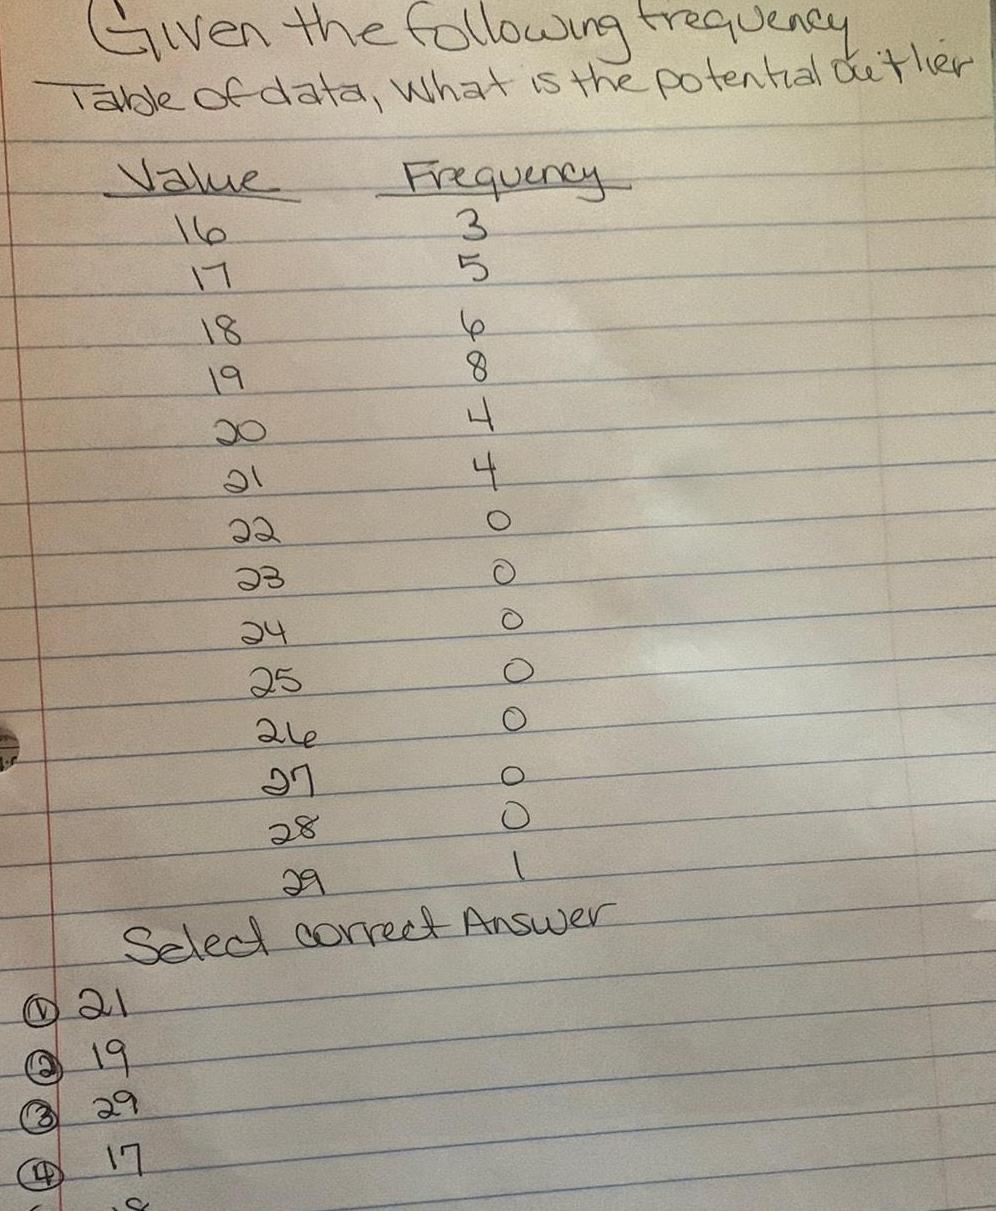
ProbabilityGiven the following frequency Table of data What is the potential outler Value 16 18 19 21 19 29 17 8 20 21 22 23 24 25 21e 27 28 Frequency 3 IAS JW 5 8 4 4 Select correct Answer

Statistics
Probability10 12am Your post is so well done Letitia It looks like you now really know what you are talking about in terms of confidence intervals This sounds like a really big study If you were doing this study within one clinic or hospital do you think that a study on the entire clinic would yield a mean close to the mean of your one unit or would the sample size have to be much larger than that What would happen if you sampled every clinic or hospital in your state Would you expect the confidence interval to be larger or smaller as you grow the number of participants in your study Reply 1

Statistics
ProbabilityThe Global Attractions Attendance Report is an annual report published by the Themed Entertainment Association It is an annual attendance study for themed entertainment and museum industries around the world The following data set includes the total yearly attendance for the top 15 water parks in millions during one year What is the potential outlier 6 7 7 7 8 8 10 10 10 11 11 13 15 16 24 Provido your answor holow

Statistics
StatisticsA data set lists the number of hours part time employees worked at an ice cream shop per week during the last year For this data set the minimum is 3 the first quartile is 5 the median is 7 the third quartile is 9 and the maximum is 19 Construct a box and whisker plot that shows the number of hours worked per week Provide your answer below

Statistics
ProbabilityWhen aggregating loyalty each 1 spent at the restaurant equates to 1 point for every item 2 points for sushi 3 points for ramen How many points will each customer have and assign a flag Y to customers with over 150 points which qualifies them to join the loyalty program 10 marks

Statistics
Statistics4 6 The following chart shows the number of defective labels on packages over a thirteen month period Pressure Upper Control Limit UCL Mean Lower Control Limit LCL Intussuing Jan Feb Mar Apr May Jun Jul Aug Sep Oct Nov Dec Jan Which of the following best explains the process history chart a The process history chart shows a periodic loss of control followed by a rapid return to normal operation after maintenance on the label print unit b The process history chart show a periodic sudden loss of control followed by a gradual return to normal operation after fixing the broken print unit c The process history chart shows a completely random pattern of equipment wear resulting in an increase in label defects d The process history chart shows a regular pattern of breakdown of the label

Statistics
StatisticsLife saving drug Penicillin is produced by the Penicillin fungus which is grown in a broth whose sugar content must be carefully controlled Several samples of Broth were taken on three successive days and the amount of dissolved sugars in milligrams per milliliter was measured on each sample The results were as ollows Day 1 5 2 5 5 5 1 4 9 5 3 5 0 5 2 5 1 5 4 5 2 4 8 5 1 5 4 5 8 5 1 5 3 5 5 5 2 4 9 5 4 5 0 5 4 5 0 5 6 5 4 5 6 5 9 4 9 5 2 5 3 5 1 5 4 5 3 5 8 5 5 5 4 5 4 5 4 5 2 Day 2 Day 3 Send data to Excel Part 1 of 2 a Construct an ANOVA table Round your answers to four decimal places as needed One way ANOVA Sugar Concentration Source Days DF 2 36 SS 0 2851 2 2185 MS 0 1426 0 0616 F 2 3135 P 0 1134

Statistics
Statisticshow do I solve this using Excel need to see formula Assumptions Poisson Arrivals Exponential Service Times Arrival Rate Service Rate Number of Servers Operating Characteristics Multiple Server Waiting Line Analysis 16 20 2

Statistics
StatisticsQuestion 1 1 point N A EMV is the weighted average of the possible payoffs for this decision weighted by the probabilities of the outcomes Hide hint for Question 1 First 2 words are 8 characters 3rd word is 5 characters

Statistics
StatisticsSuppose a shoe store wants to determine the current percentage of customers who are males How many customers should the company survey in order to be 98 confident that the estimated sample proportion is within 3 percentage points of the true population proportion of customers who are males Z0 05 Z0 025 1 645 1 960 Use the table of values above ZO 10 1 282 Z0 01 2 326 Zo 005 2 576

Statistics
Statisticsto determine the current percentage of customers pox the Automobile Repair Company wits who keep up with regular vehicle materier How many customers should the company Survey to be 95 confident that the estimated sample proportion is within 4 percentage points of the true population proportion of customers who keep up with regular vehicle notautenance in order 2010 2005 2 0 025 2001 20 005 1 645 1 960 2 336 2 57 3 115 151 103

Statistics
StatisticsSuppose an autom to determine the current percentage who keep up with regular vehicle maintenance How many customers should the company Survey in order to be 98 confident that the estimated Sample proportion is within Sporcentage points of the true population proportion of customers who keep up with regular vehicle maintenance Use the table of Values 20 10 20 05 20 075 20 01 20 005 1 645 1960 1 282 2 324 2 576 Select the correct Answer below 34 43 5136 3 422 542

Statistics
StatisticsThe lengths in inches of adult corn snakes are normally distributed with a population standard deviation of 8 inches and an unknown population mean A random sample of 25 snakes is taken and results in a sample mean of 58 inches What is the correct interpretation of the confidence interval Select the correct answer below We can estimate with 99 confidence that the true population mean length of adult corn snakes is between 53 88 and 62 12 inches We can estimate with 99 confidence that the sample mean length of adult corn snakes is between 53 88 and 62 12 inches O We can estimate that 99 of adult corn snakes will have a length that is between 53 88 and 62 12 inches

Statistics
StatisticsLocation Library Hospital Nursing home Tutoring center Number of students 17 9 18 locations Here is a summary Three students from the club are selected at random one at a time without replacement What is the probability that the first two students volunteer at the library and the third volunteers at the hospital Do not round your intermediate computations Round your final answer to three decimal places If necessary consult a list of formulas

Statistics
StatisticsThe scatter plot shows the theater revenue and rental revenue for each of 25 movies Also shown is the line of best fit for the data Fill in the blanks below Rental revenue in millions of dollars 24 22 22 36 14 1 x x XX x x X Theater revenue in millions of dollars X X xx 90 100 110 4 a For these 25 movies as theater revenue increases rental revenue tends to Choose one b For these 25 movies there is Choose one correlation between theater revenue and rental revenue c Using the line of best fit we would predict that a movie generating a theater revenue of 40 million dollars would X

Statistics
StatisticsThe hoon temperatures in Fahrenheit for two cities were recorded over a given month The box and whisker plots below sometimes called boxplots summarize the noon temperatures for each city Use the box and whisker plots to answer the questions 55 60 65 70 80 Noon temperature in Fahrenheit 75 a Which city had a smaller range of noon temperatures b Which city had noon temperatures with a larger interquartile range IQR c which city had a larger median noon temperature 85 90 Choose one Choose one Choose one City A City B 95

Statistics
StatisticsThe company would like your help in making a recommendation on the ideal mean setting that should be set for each vending machine so that the cups do not overflow or underfill Based on your findings from Part 1 decide a mean setting and a standard deviation you would recommend for the company Remember each cup holds 8 ounces The company would like to reduce the variability and keep the standard deviation low to ensure that most of the cups are not overflowing or underfilling Provide appropriate graphical and numerical evidence to support your recommendation Mean 8 23 Deviation 47 Part 3 Extra Practice stool The company wanted to compare two vending machine reports as part of a quality control check Use the data in Attachment B tab 2 to compare with the first vending machine in Attachment A Remember each cup holds 8 ounces Find the mean and standard deviation of the 2nd vending machine and compare it to the first machine How does 95 of the data for machine A compare with 95 of the data from machine B Which machine is more accurate in your opinion Why