Statistics Questions
The best high school and college tutors are just a click away, 24×7! Pick a subject, ask a question, and get a detailed, handwritten solution personalized for you in minutes. We cover Math, Physics, Chemistry & Biology.
Statistics
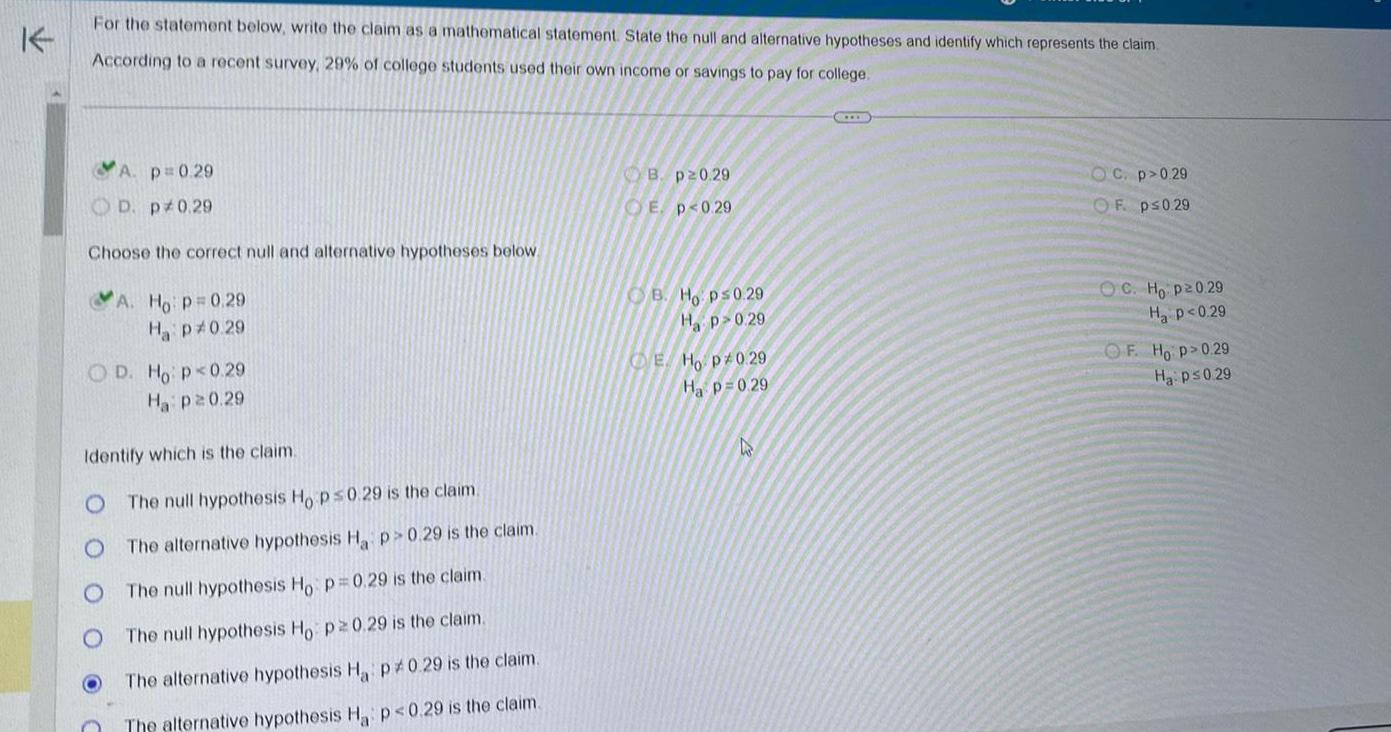
StatisticsFor the statement below write the claim as a mathematical statement State the null and alternative hypotheses and identify which represents the claim According to a recent survey 29 of college students used their own income or savings to pay for college A p 0 29 D p 0 29 Choose the correct null and alternative hypotheses below A Ho p 0 29 Ha p 0 29 OD Ho p 0 29 Ha p20 29 O Identify which is the claim The null hypothesis Ho p 0 29 is the claim The alternative hypothesis Ha p 0 29 is the claim The null hypothesis Ho p 0 29 is the claim The null hypothesis Ho p 0 29 is the claim The alternative hypothesis Ha p0 29 is the claim The alternative hypothesis Ha p 0 29 is the claim B p20 29 E p 0 29 B Ho p 0 29 Hp 0 29 E Ho p 0 29 Ha p 0 29 h IEE OC p 0 29 OF p 0 29 OC Ho p20 29 H P 0 29 OF Ho p 0 29 Ha p 0 29
Statistics
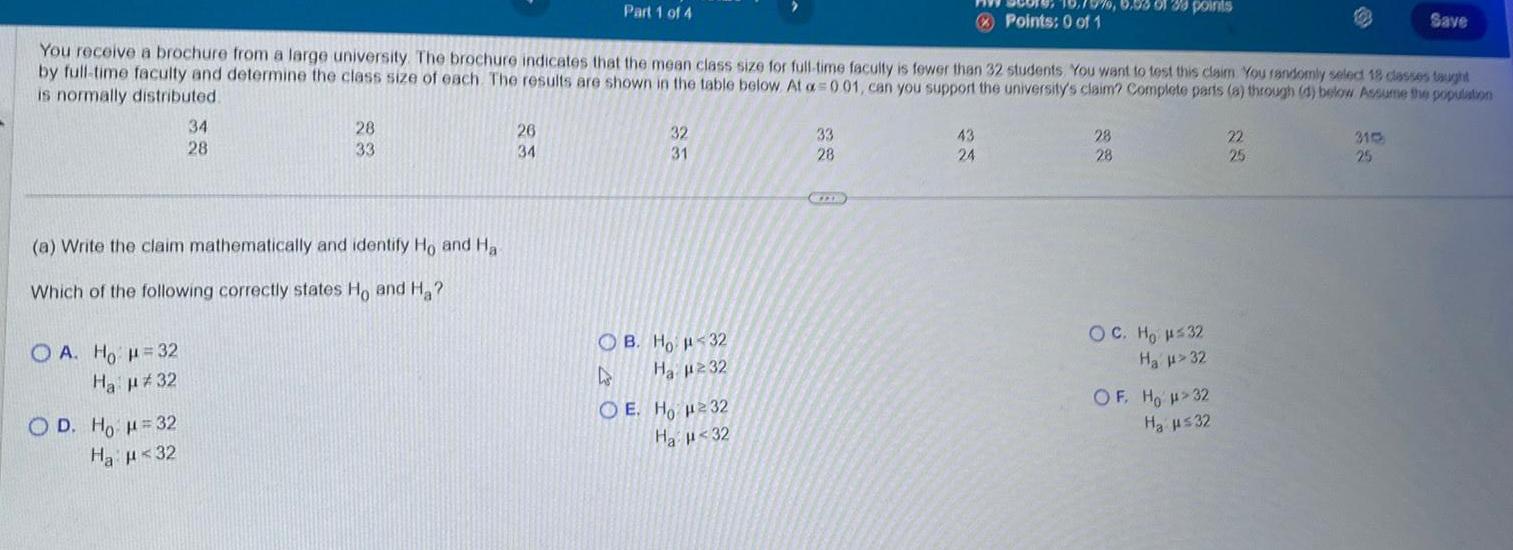
StatisticsOA Ho H 32 Ha 32 34 28 a Write the claim mathematically and identify Ho and Ha Which of the following correctly states Ho and H OD Ho H 32 Ha 32 You receive a brochure from a large university The brochure indicates that the mean class size for full time faculty is fewer than 32 students You want to test this claim You randomly select 18 classes taught by full time faculty and determine the class size of each The results are shown in the table below At a 001 can you support the university s claim Complete parts a through d below Assume the population is normally distributed 28 33 Part 1 of 4 26 34 32 31 OB Ho 32 As Ha 232 OE Ho H232 Ha 32 33 28 970 6 58 01 38 points 43 24 Points 0 of 1 28 28 OC Ho H 32 Ha 32 OF HO H 32 H 32 Save 22 25
Statistics
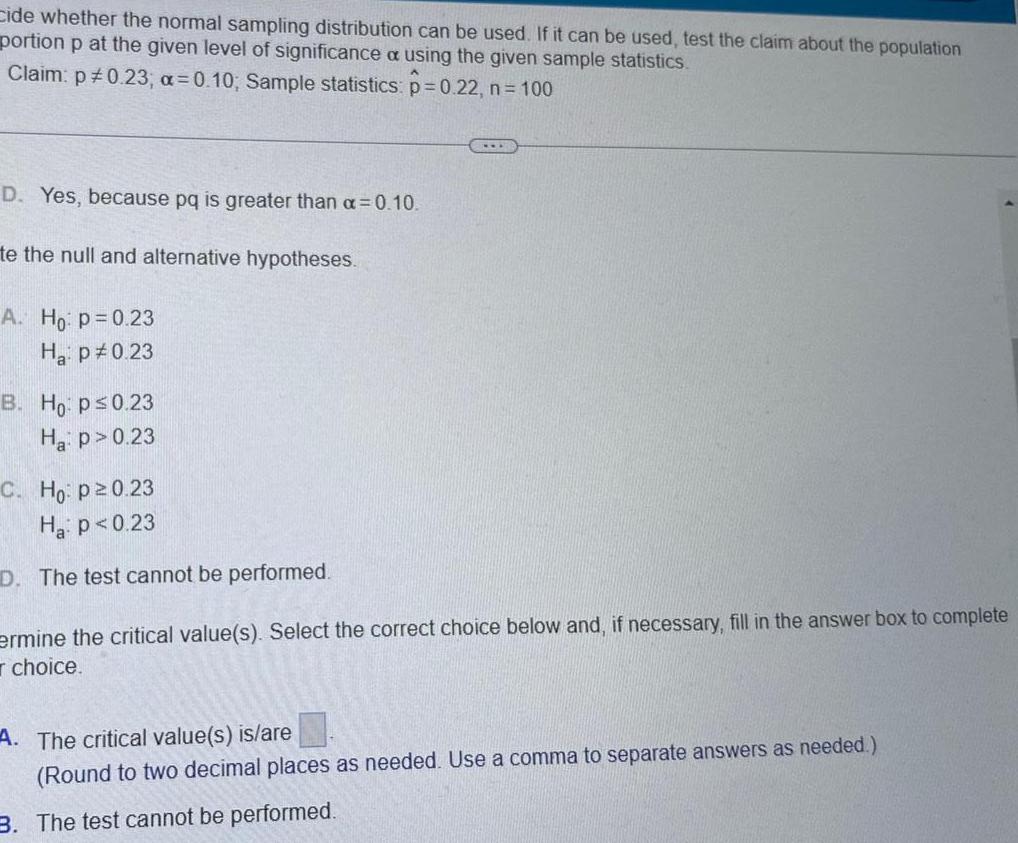
Statisticscide whether the normal sampling distribution can be used If it can be used test the claim about the population portion p at the given level of significance a using the given sample statistics Claim p 0 23 a 0 10 Sample statistics p 0 22 n 100 D Yes because pq is greater than a 0 10 te the null and alternative hypotheses A Ho p 0 23 Ha p 0 23 B Ho p 0 23 Ha p 0 23 C Ho p20 23 Ha p 0 23 D The test cannot be performed ermine the critical value s Select the correct choice below and if necessary fill in the answer box to complete choice A The critical value s is are Round to two decimal places as needed Use a comma to separate answers as needed 3 The test cannot be performed
Statistics
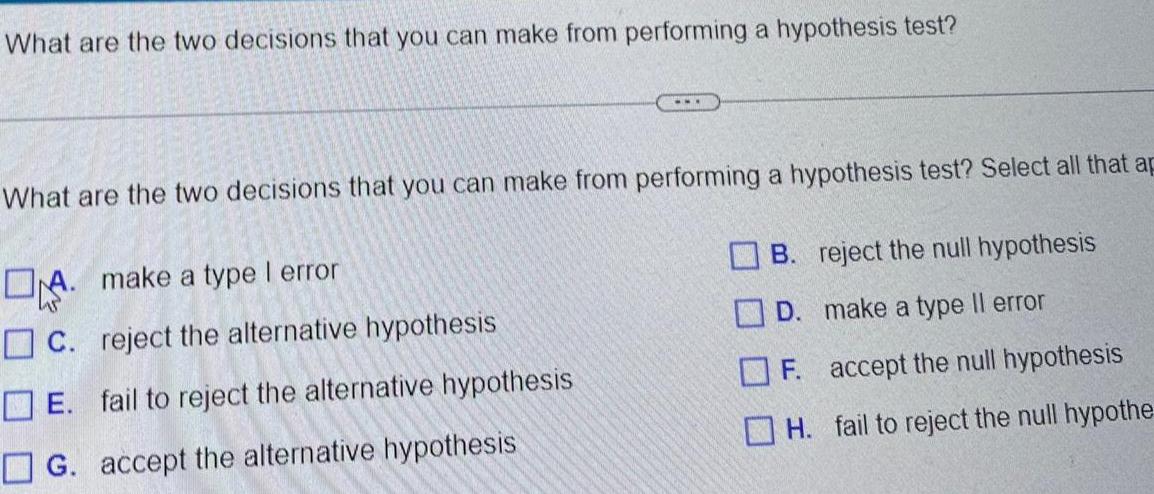
StatisticsWhat are the two decisions that you can make from performing a hypothesis test What are the two decisions that you can make from performing a hypothesis test Select all that ap A make a type I error C reject the alternative hypothesis E fail to reject the alternative hypothesis G accept the alternative hypothesis B reject the null hypothesis D make a type Il error F accept the null hypothesis H fail to reject the null hypothe
Statistics
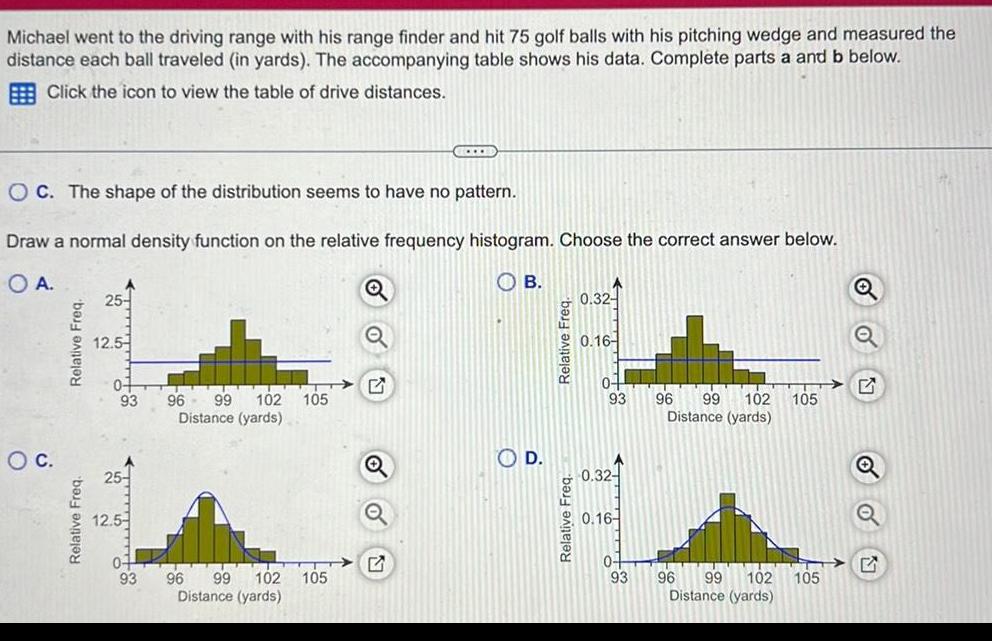
StatisticsMichael went to the driving range with his range finder and hit 75 golf balls with his pitching wedge and measured the distance each ball traveled in yards The accompanying table shows his data Complete parts a and b below Click the icon to view the table of drive distances OC The shape of the distribution seems to have no pattern Draw a normal density function on the relative frequency histogram Choose the correct answer below OA OC Relative Freq Relative Freq 25 12 5 93 96 99 102 105 Distance yards 55 12 5 93 C 96 99 102 105 Distance yards B OD Relative Freq Relative Freq 0 32 0 16 0 93 0 32 0 16 0 93 96 99 102 105 Distance yards 96 99 102 Distance yards 105
Statistics
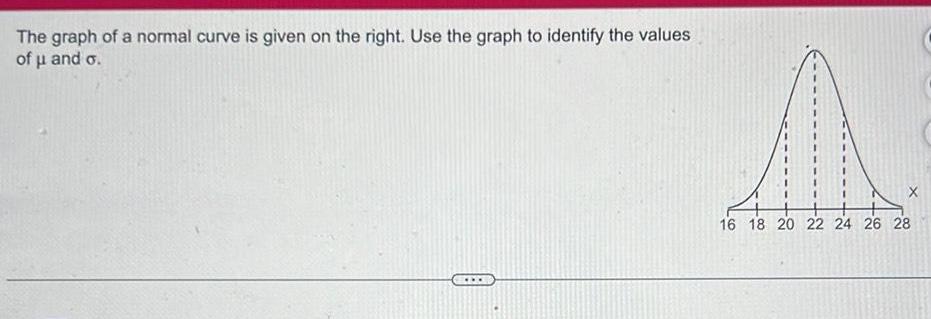
StatisticsThe graph of a normal curve is given on the right Use the graph to identify the values of and o www A 16 18 20 22 24 26 28
Statistics
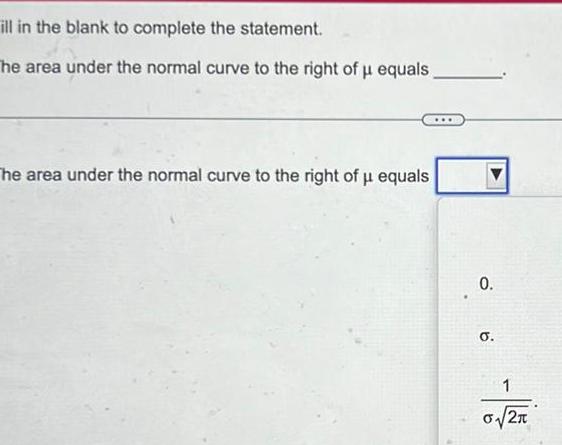
Probabilityill in the blank to complete the statement The area under the normal curve to the right of u equals The area under the normal curve to the right of u equals 0 O 1 2
Statistics
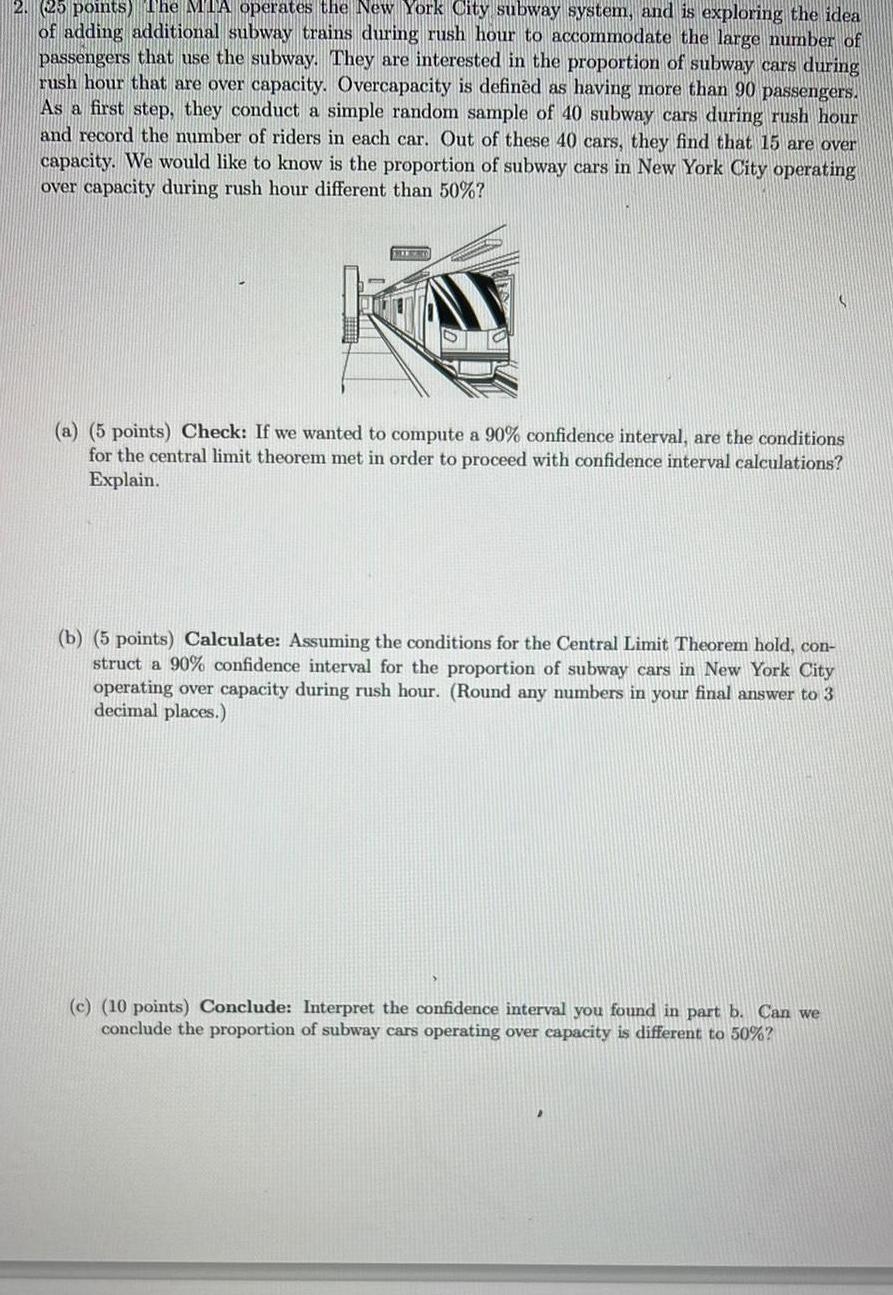
Probability2 25 points The MTA operates the New York City subway system and is exploring the idea of adding additional subway trains during rush hour to accommodate the large number of passengers that use the subway They are interested in the proportion of subway cars during rush hour that are over capacity Overcapacity is defined as having more than 90 passengers As a first step they conduct a simple random sample of 40 subway cars during rush hour and record the number of riders in each car Out of these 40 cars they find that 15 are over capacity We would like to know is the proportion of subway cars in New York City operating over capacity during rush hour different than 50 HIERO a 5 points Check If we wanted to compute a 90 confidence interval are the conditions for the central limit theorem met in order to proceed with confidence interval Explain b 5 points Calculate Assuming the conditions for the Central Limit Theorem hold con struct a 90 confidence interval for the proportion of subway cars in New York City operating over capacity during rush hour Round any numbers in your final answer to 3 decimal places c 10 points Conclude Interpret the confidence interval you found in part b Can we conclude the proportion of subway cars operating over capacity is different to 50
Statistics
Probability1 25 points A group of researchers claims that a city s collee of people favoring coffee over other beverages This claim was determined by conducting a hypothesis test at a significance level of 0 05 According to their test results they found evidence against the null hypothesis which stated that the true proportion is 35 Upon further investigation you found out that the test statistic for their test was 2 33 The researchers also revealed that the observed proportion of people who actually preferred coffee in their sample was 30 The researchers also hinted that they used a two sided test for their study COFFEE a 10 points Assuming the conditions for the central limit theorem are met estimate the sample size they might have used for this study b 5 points Under what conditions is the Central Limit Theorem applicable Are all the conditions met in this problem If not state what additional statement would need to be made
Statistics
Probability4 20 points The Bureau of Labor Statistics estimates that 58 1 of the working age population in the United States are employed full time a 5 points We randomly select three individuals of working age What is the probability that the third person selected is the only one who is employed full time b 5 points What is the probability that all three randomly selected individuals are em ployed full time c 5 points On average how many individuals would you expect to sample before selecting one who is employed full time
Statistics
Statistics2 40 Among all cars in a junkyard 10 of them lasted for more than 15 years a If you randomly choose 15 cars from this junkyard what is the chance that at least two of them aged over 15 years b Continue from part a how many of cars out of 15 do you expect to have that are older than 15 years
Statistics
Statistics1 60 GPA distribution of UPW is a normal distribution with average and standard deviation of 2 78 and MAAAAAAA 42 respectively a If you randomly chose a student s GPA what is the chance that the GPA is less than 3 b If your know a student s GPA is less than 3 what is the chance that his her GPA is less than 2 5 c If 10 students were chosen what is the probability that exactly three of them have GPA between 2 and 3 d If a scholarship requires a minimum GPA being top 8 what is the minimum value of GPA to qualify ah archolarshin
Statistics
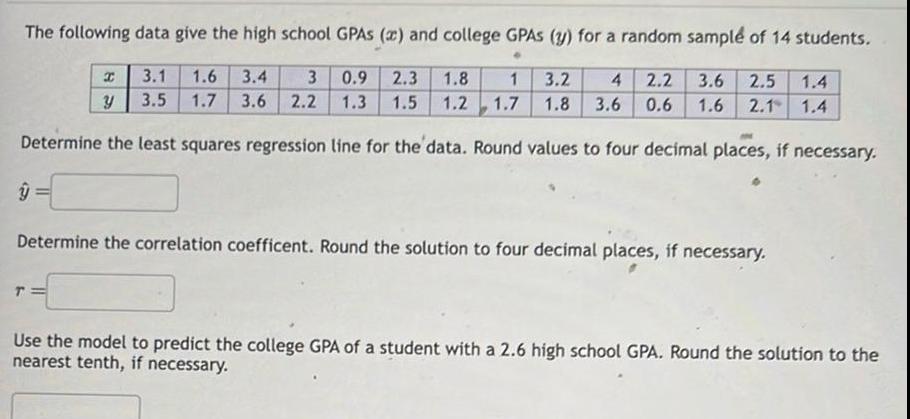
StatisticsThe following data give the high school GPAS x and college GPAS 3 for a random sample of 14 students 3 1 1 6 3 4 3 0 9 2 3 1 8 3 5 1 7 3 6 2 2 1 3 1 5 1 2 1 3 2 4 2 2 3 6 2 5 1 4 1 7 1 8 3 6 0 6 1 6 2 1 1 4 Determine the least squares regression line for the data Round values to four decimal places if necessary I Y Determine the correlation coefficent Round the solution to four decimal places if necessary Use the model to predict the college GPA of a student with a 2 6 high school GPA Round the solution to the nearest tenth if necessary
Statistics
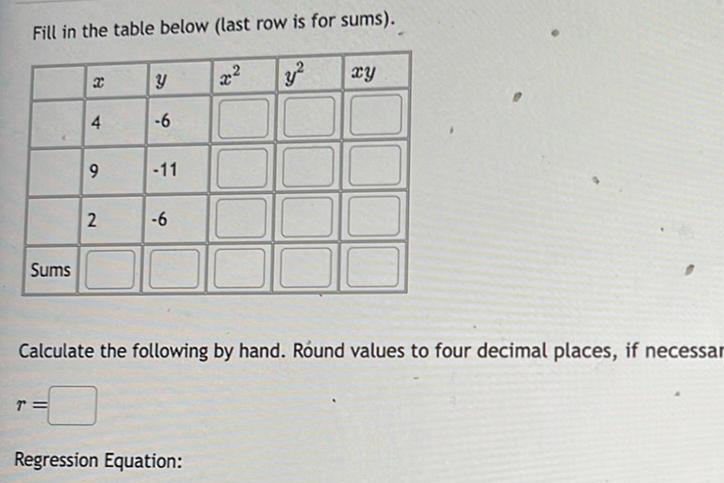
StatisticsFill in the table below last row is for sums Sums x T 4 9 2 Y 6 11 6 y Calculate the following by hand Round values to four decimal places if necessar Regression Equation xy
Statistics
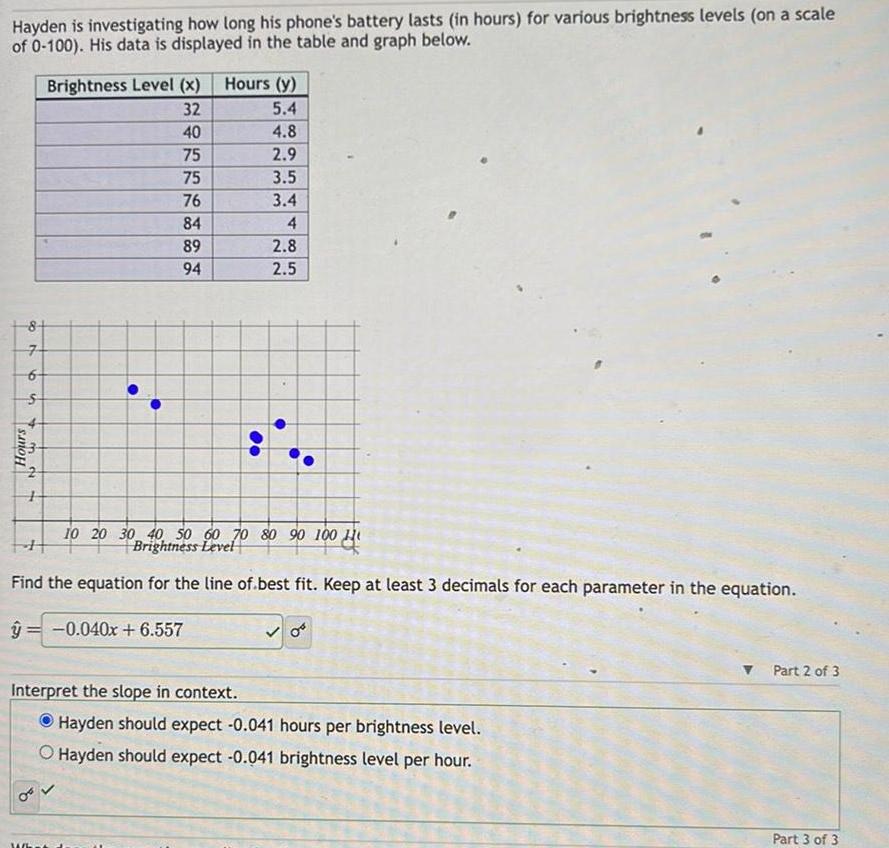
StatisticsHayden is investigating how long his phone s battery lasts in hours for various brightness levels on a scale of 0 100 His data is displayed in the table and graph below 8 7 6 Hours 5 3 04 Brightness Level x 32 40 75 75 76 84 89 94 Wh Hours y 5 4 4 8 2 9 3 5 3 4 4 2 8 2 5 10 20 30 Brightness Leve70 80 90 100 H Find the equation for the line of best fit Keep at least 3 decimals for each parameter in the equation y 0 040x 6 557 0 Interpret the slope in context Hayden should expect 0 041 hours per brightness level O Hayden should expect 0 041 brightness level per hour Part 2 of 3 Part 3 of 3

Statistics
StatisticsIn the workplace who is likely to have the most influence on the organization s culture Employees Customers Managers Business Owners
Statistics
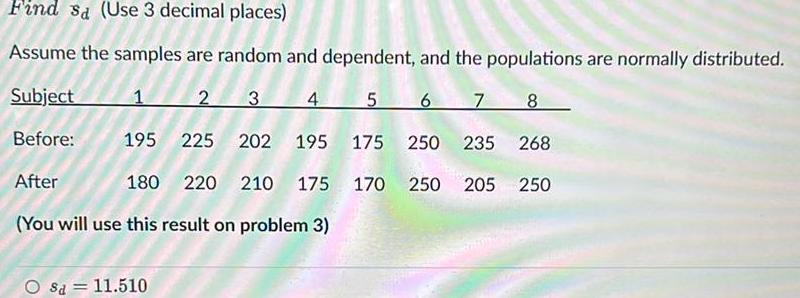
ProbabilityFind sa Use 3 decimal places Assume the samples are random and dependent and the populations are normally distributed Subject 1 2 3 4 5 6 7 8 Before 195 225 202 195 175 250 235 268 After 180 220 210 175 170 250 205 250 You will use this result on problem 3 Sa 11 510
Statistics
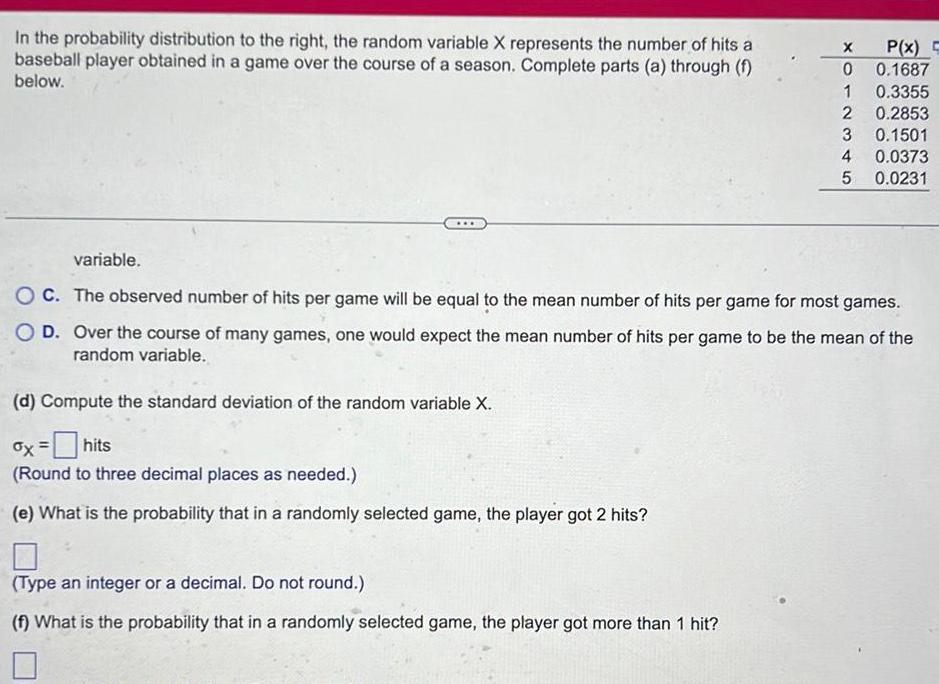
StatisticsIn the probability distribution to the right the random variable X represents the number of hits a baseball player obtained in a game over the course of a season Complete parts a through f below d Compute the standard deviation of the random variable X ox hits Round to three decimal places as needed e What is the probability that in a randomly selected game the player got 2 hits X 0 1 2 Type an integer or a decimal Do not round f What is the probability that in a randomly selected game the player got more than 1 hit 3 4 5 P x 0 1687 variable OC The observed number of hits per game will be equal to the mean number of hits per game for most games O D Over the course of many games one would expect the mean number of hits per game to be the mean of the random variable 0 3355 0 2853 0 1501 0 0373 0 0231
Statistics
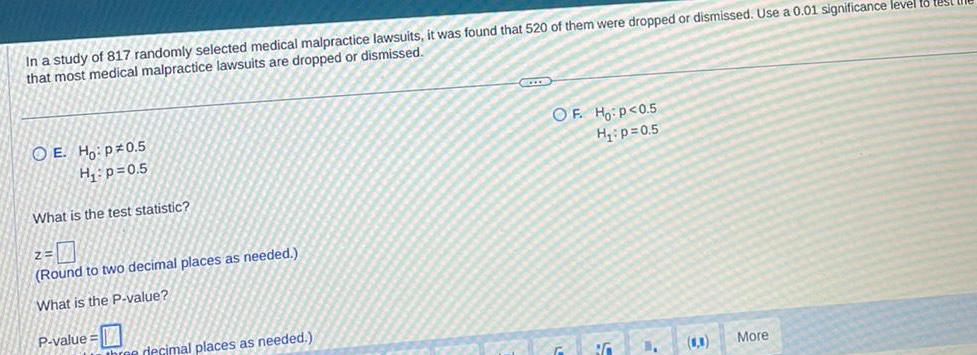
StatisticsIn a study of 817 randomly selected medical malpractice lawsuits it was found that 520 of them were dropped or dismissed Use a 0 01 significance level to test that most medical malpractice lawsuits are dropped or dismissed OE Ho p0 5 H p 0 5 What is the test statistic 2 7 Round to two decimal places as needed What is the P value P value three decimal places as needed OF Ho P 0 5 H p 0 5 BG C More
Statistics
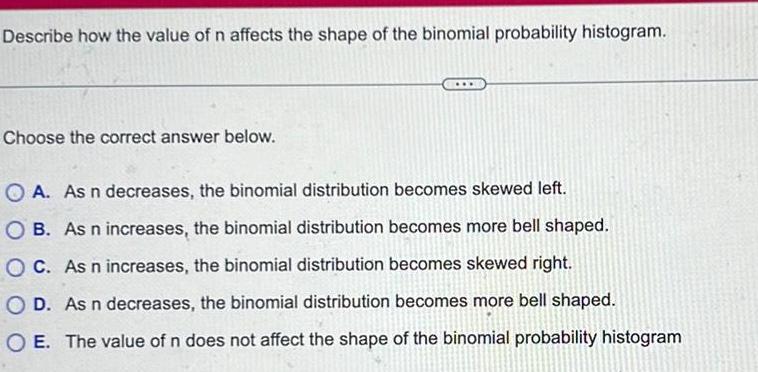
StatisticsDescribe how the value of n affects the shape of the binomial probability histogram Choose the correct answer below A As n decreases the binomial distribution becomes skewed left OB As n increases the binomial distribution becomes more bell shaped OC As n increases the binomial distribution becomes skewed right O D As n decreases the binomial distribution becomes more bell shaped O E The value of n does not affect the shape of the binomial probability histogram
Statistics
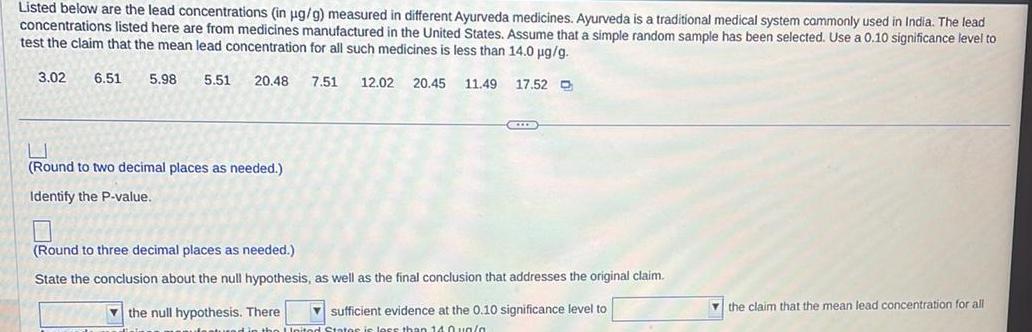
StatisticsListed below are the lead concentrations in ug g measured in different Ayurveda medicines Ayurveda is a traditional medical system commonly used in India The lead concentrations listed here are from medicines manufactured in the United States Assume that a simple random sample has been selected Use a 0 10 significance level to test the claim that the mean lead concentration for all such medicines is less than 14 0 g g 3 02 6 51 5 98 5 51 20 48 7 51 12 02 20 45 11 49 17 52 D Round to two decimal places as needed Identify the P value CCD Round to three decimal places as needed State the conclusion about the null hypothesis as well as the final conclusion that addresses the original claim the null hypothesis There sufficient evidence at the 0 10 significance level to United States is less than 140un a the claim that the mean lead concentration for all
Statistics
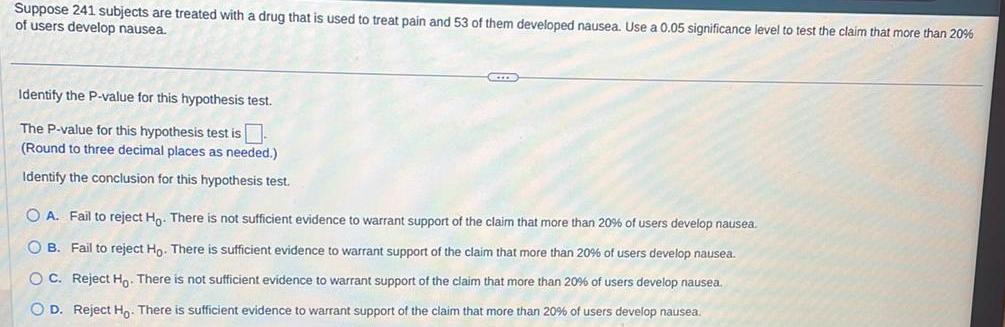
StatisticsSuppose 241 subjects are treated with a drug that is used to treat pain and 53 of them developed nausea Use a 0 05 significance level to test the claim that more than 20 of users develop nausea Identify the P value for this hypothesis test The P value for this hypothesis test is Round to three decimal places as needed Identify the conclusion for this hypothesis test SCIE OA Fail to reject Ho There is not sufficient evidence to warrant support of the claim that more than 20 of users develop nausea OB Fail to reject Ho There is sufficient evidence to warrant support of the claim that more than 20 of users develop nausea OC Reject Ho There is not sufficient evidence to warrant support of the claim that more than 20 of users develop nausea O D Reject Ho There is sufficient evidence to warrant support of the claim that more than 20 of users develop nausea
Statistics
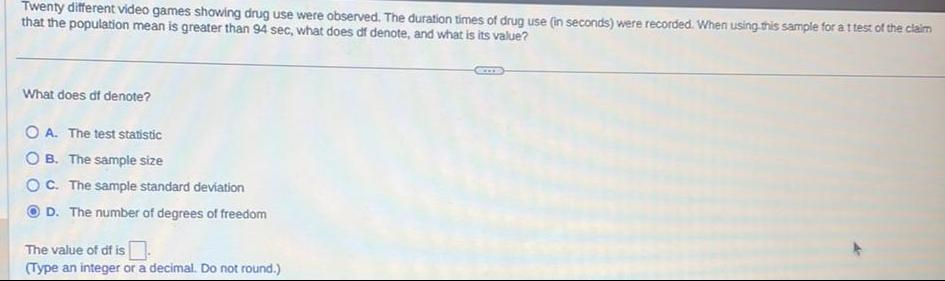
StatisticsTwenty different video games showing drug use were observed The duration times of drug use in seconds were recorded When using this sample for a t test of the claim that the population mean is greater than 94 sec what does df denote and what is its value What does df denote OA The test statistic OB The sample size OC The sample standard deviation D The number of degrees of freedom The value of df is Type an integer or a decimal Do not round
Statistics
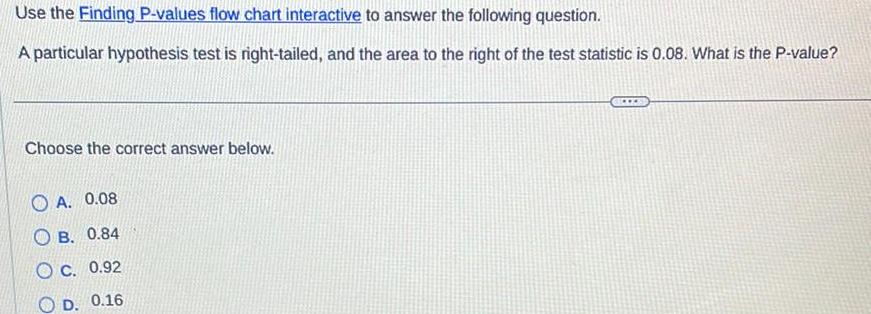
StatisticsUse the Finding P values flow chart interactive to answer the following question A particular hypothesis test is right tailed and the area to the right of the test statistic is 0 08 What is the P value Choose the correct answer below A 0 08 OB 0 84 OC 0 92 OD 0 16
Statistics
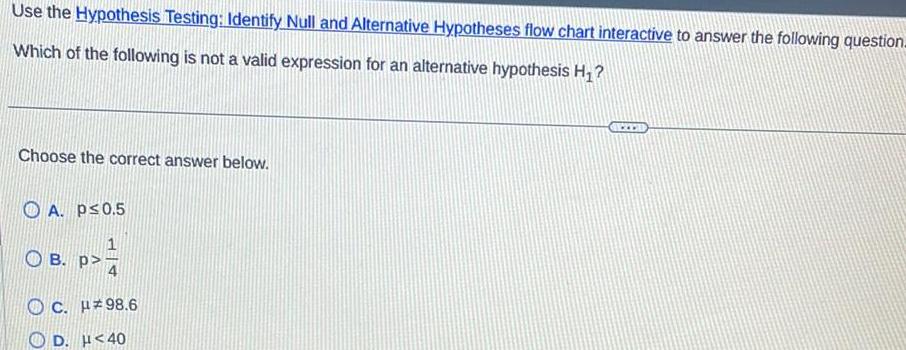
StatisticsUse the Hypothesis Testing Identify Null and Alternative Hypotheses flow chart interactive to answer the following question Which of the following is not a valid expression for an alternative hypothesis H Choose the correct answer below A p 0 5 OB P C H 98 6 D H 40
Statistics
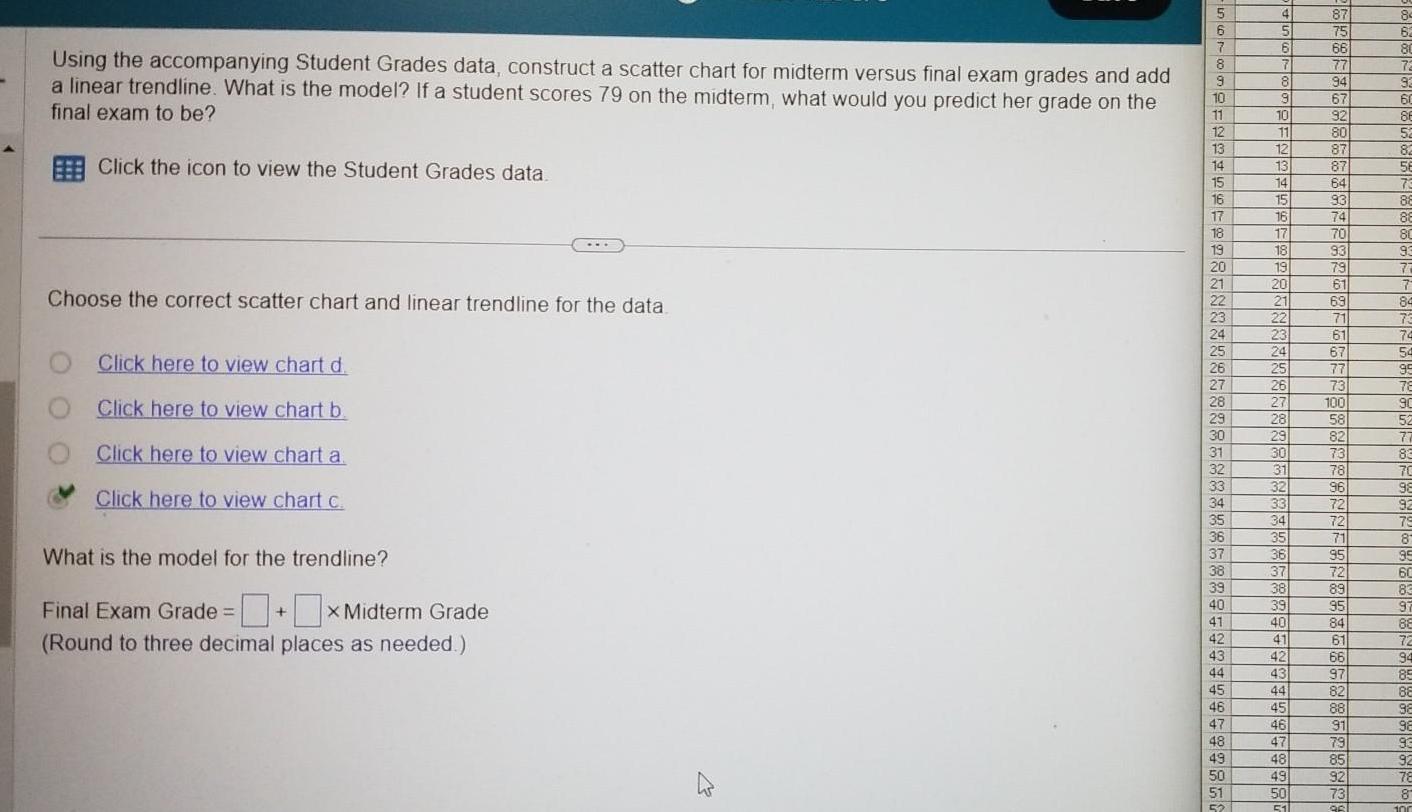
StatisticsUsing the accompanying Student Grades data construct a scatter chart for midterm versus final exam grades and add a linear trendline What is the model If a student scores 79 on the midterm what would you predict her grade on the final exam to be Click the icon to view the Student Grades data Choose the correct scatter chart and linear trendline for the data Click here to view chart d Click here to view chart b Click here to view chart a Click here to view chart c What is the model for the trendline Final Exam Grade X Midterm Grade 0 Round to three decimal places as needed 5 6 7 8 9 10 11 12 13 14 15 16 17 18 19 20 21 22 23 24 25 26 27 28 29 30 31 32 33 34 35 36 37 38 39 40 41 42 43 44 45 46 47 48 49 50 51 52 4 5 6 6 7 8 9 10 11 12 13 14 15 16 17 18 19 20 21 22 23 24 25 26 27 28 29 30 31 32 33 34 35 36 37 38 39 40 41 42 43 44 45 46 47 48 49 50 51 87 75 66 77 94 67 92 80 87 87 64 93 74 70 93 79 61 69 71 61 67 77 73 100 58 82 73 78 96 72 72 71 95 72 89 95 84 61 66 97 82 88 91 79 85 92 73 96 8 62 80 72 92 60 86 52 82 56 73 88 88 80 93 77 7 84 73 74 54 95 78 90 77 83 70 98 92 79 87 95 60 83 97 88 72 94 85 88 92 98 93 92 78 8 100
Statistics
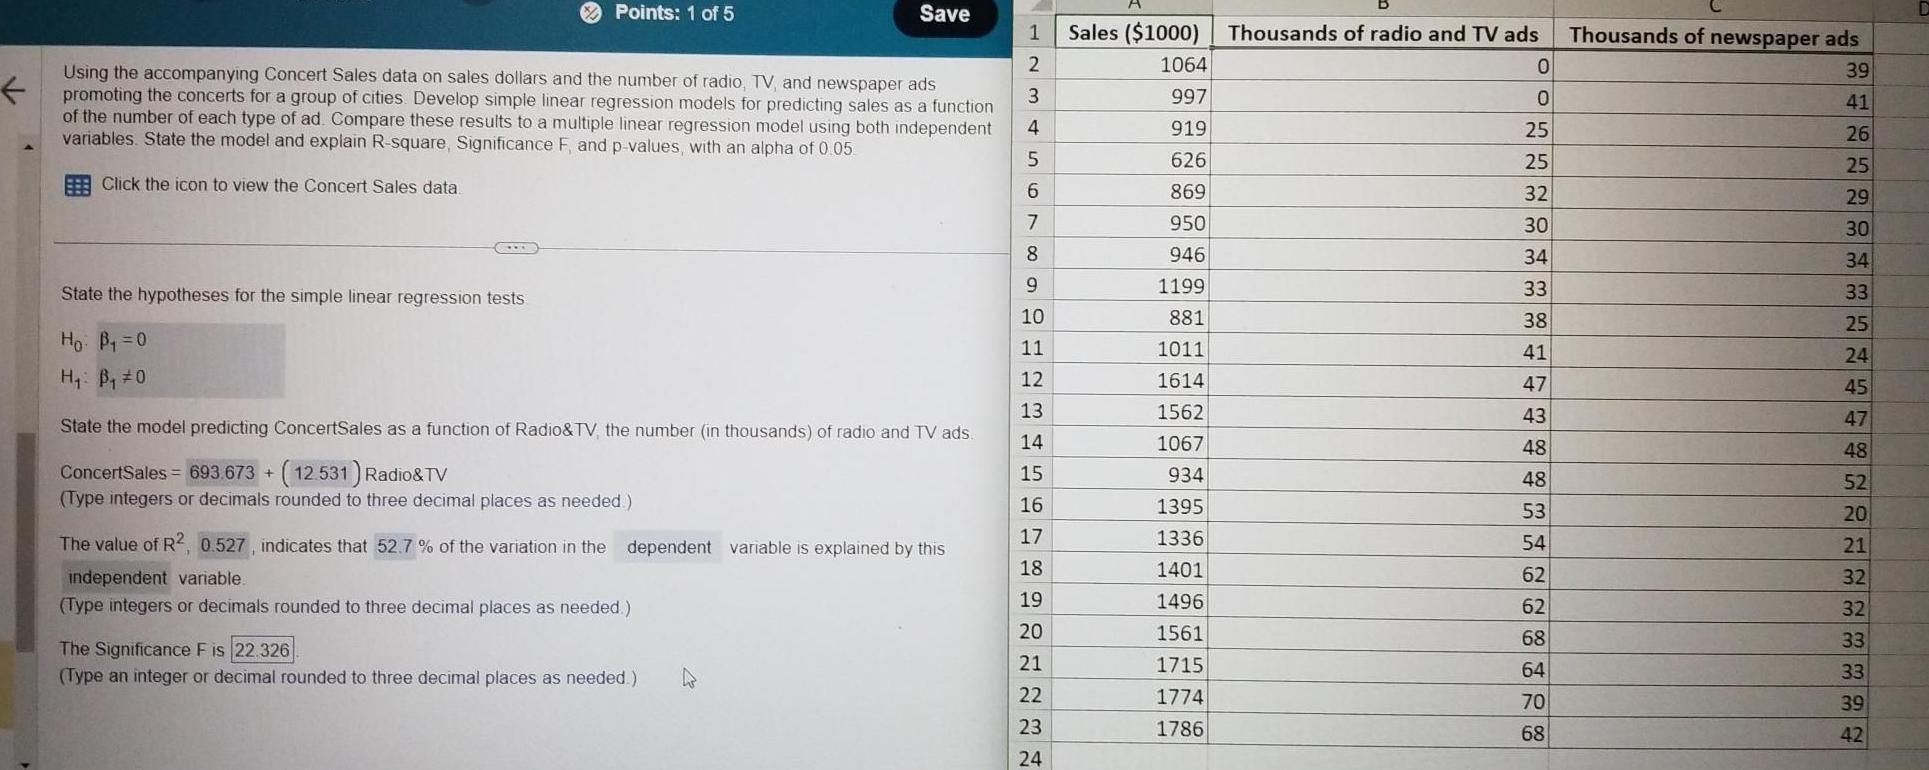
StatisticsPoints 1 of 5 State the hypotheses for the simple linear regression tests Ho B 0 H B 0 Using the accompanying Concert Sales data on sales dollars and the number of radio TV and newspaper ads promoting the concerts for a group of cities Develop simple linear regression models for predicting sales as a function of the number of each type of ad Compare these results to a multiple linear regression model using both independent variables State the model and explain R square Significance F and p values with an alpha of 0 05 Click the icon to view the Concert Sales data State the model predicting ConcertSales as a function of Radio TV the number in thousands of radio and TV ads ConcertSales 693 673 12 531 Radio TV Type integers or decimals rounded to three decimal places as needed The value of R2 0 527 indicates that 52 7 of the variation in the independent variable Type integers or decimals rounded to three decimal places as needed Save dependent variable is explained by this The Significance F is 22 326 Type an integer or decimal rounded to three decimal places as needed 4 1 455 A WNT 2 3 4 6 7 8 9 10 11 12 13 14 15 16 17 18 19 20 21 22 23 24 Sales 1000 1064 997 919 626 869 950 946 1199 881 1011 1614 1562 1067 934 1395 1336 1401 1496 1561 1715 1774 1786 Thousands of radio and TV ads 0 0 25 25 32 30 34 33 38 41 47 43 48 48 53 54 62 62 68 64 70 68 Thousands of newspaper ads 39 41 26 25 29 30 34 33 25 24 45 47 48 52 20 21 32 32 33 33 39 42
Statistics
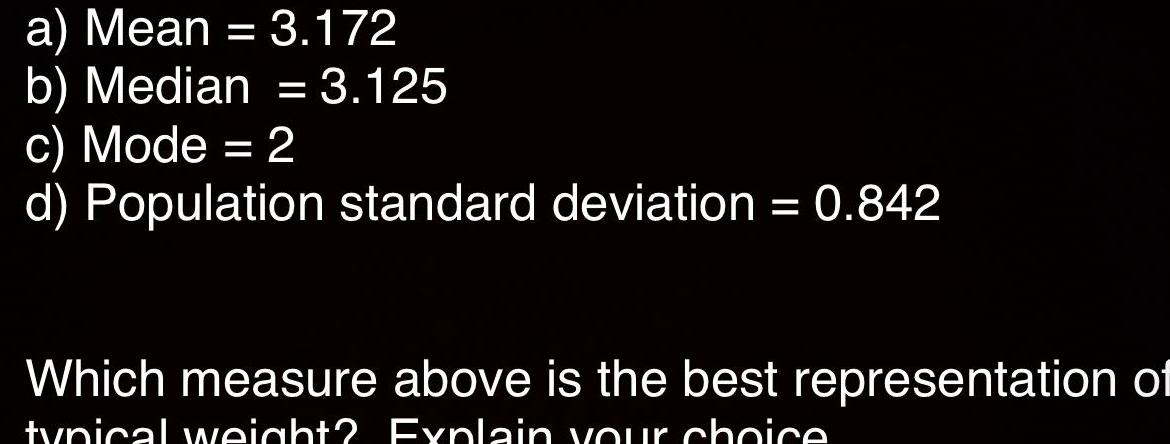
Statisticsa Mean 3 172 b Median 3 125 c Mode 2 d Population standard deviation 0 842 Which measure above is the best representation of typical weight Explain your choice
Statistics
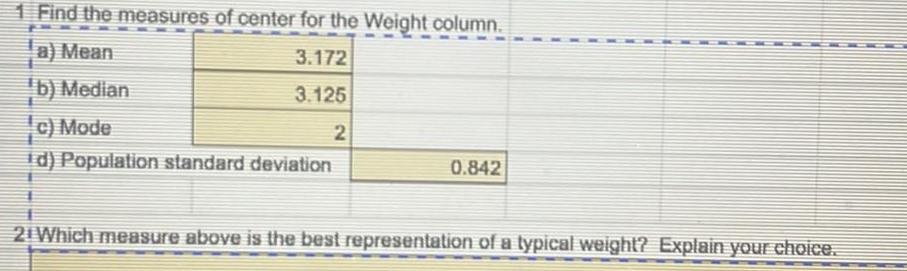
Statistics1 Find the measures of center for the Weight column a Mean 3 172 b Median 3 125 c Mode 2 d Population standard deviation 0 842 21 Which measure above is the best representation of a typical weight Explain your choice

Statistics
StatisticsPart 4 of 18 E points Points 0 5 of 5 K Using the accompanying Concert Sales data on sales dollars and the number of radio TV and newspaper ads promoting the concerts for a group of cities Develop simple linear regression models for predicting sales as a function of the number of each type of ad Compare these results to a multiple linear regression model using both independent variables State the model and explain R square Significance F and p values with an alpha of 0 06 Click the icon to view the Concert Sales data State the hypotheses for the simple linear regression tests Ho P 0 H P 0 Save State the model predicting ConcertSales as a function of Radio TV the number in thousands of radio and TV ads Concertsales 603 673 12 531 Radio TV Type integers or decimals rounded to three decimal places as needed The value of R 0 527 indicates that 527 of the variation in the dependent variable is explained by this independent variable Type integers or decimals rounded to three decimal places as needed The Significance Fis Type an integer or decimal rounded to three decimal places as needed 2 3 4 5 3 6 7 8 9 10 11 12 13 14 15 16 17 18 19 20 21 22 23 24 1064 997 919 626 869 950 946 FTININ 1199 881 ww 1011 1614 1614 1562 1067 934 1395 1395 1336 INOL 1401 1496 1561 1715 1774 1786 0 0 25 25 2 32 29 30 2 34 M 33 38 41 P 47 43 48 48 52 53 54 62 62 68 64 70 68 aus 39 41 26 25 29 29 30 20 34 33 T 25 24 45 47 48 20 52 E 20 DE 21 32 22 32 3 3 33 39 42
Statistics
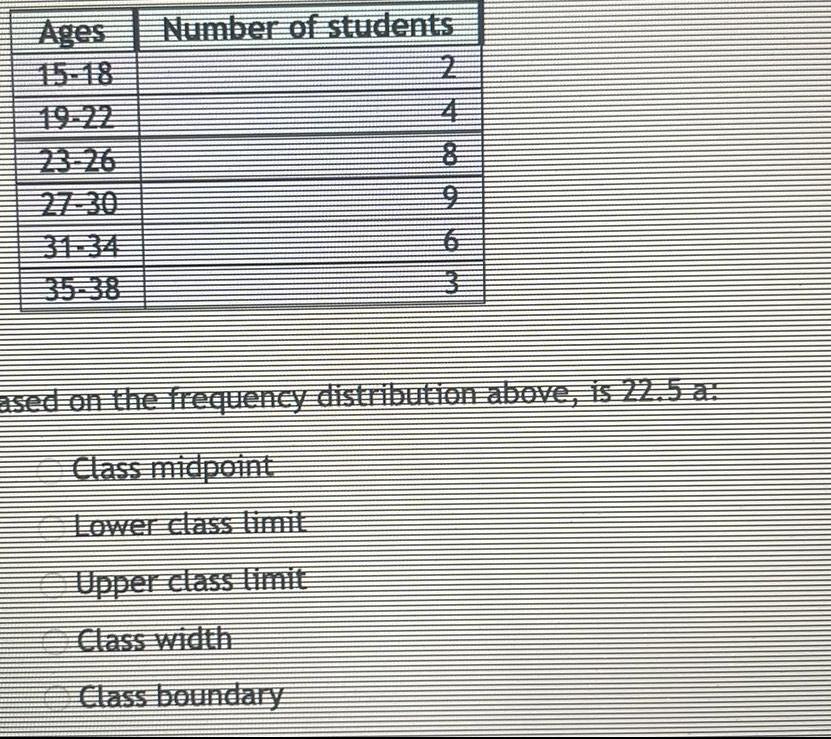
StatisticsAges Number of students 9 ased on the frequency distribution above is 22 5 a Class midpoint Lower class limit Upper class limit Class boundary
Statistics
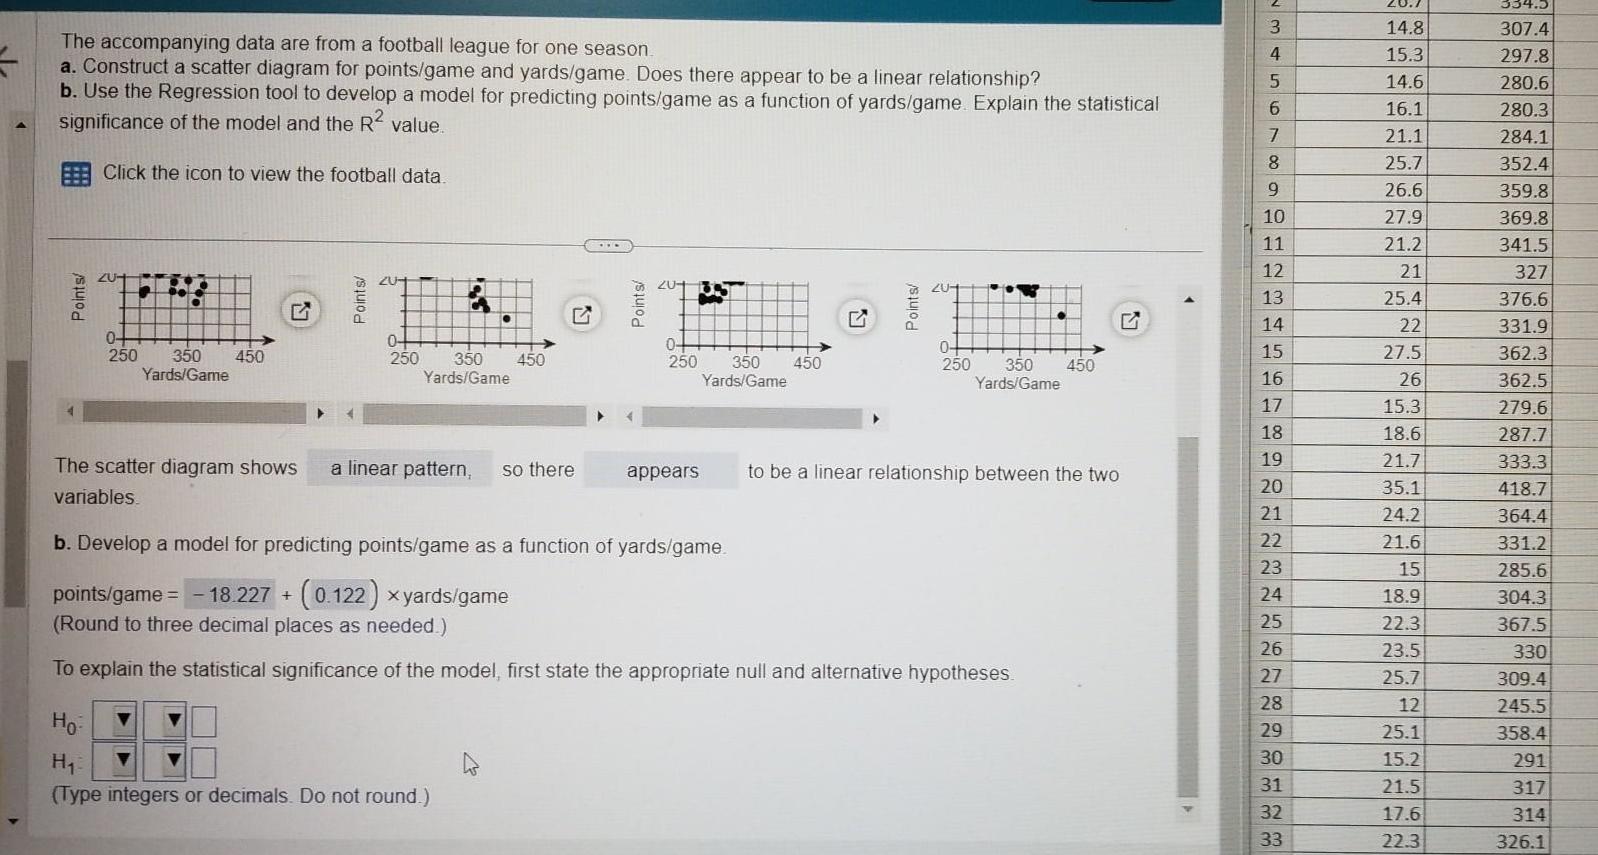
StatisticsThe accompanying data are from a football league for one season a Construct a scatter diagram for points game and yards game Does there appear to be a linear relationship b Use the Regression tool to develop a model for predicting points game as a function of yards game Explain the statistical significance of the model and the R value Click the icon to view the football data Points ZU 0 250 350 450 Yards Game The scatter diagram shows variables Ho Points Z2U44 0 250 350 Yards Game 450 a linear pattern so there 20 4 H Type integers or decimals Do not round 0 250 appears b Develop a model for predicting points game as a function of yards game 18 227 0 122 xyards game 350 450 Yards Game G Points 204 0 250 350 450 Yards Game points game Round to three decimal places as needed To explain the statistical significance of the model first state the appropriate null and alternative hypotheses to be a linear relationship between the two 3 4 5 6 7 2355N8L 9 10 11 12 13 14 15 16 17 18 19 20 21 22 2215 23 24 26 27 28 29 30 31 32 33 20 7 14 8 15 3 14 6 16 1 21 1 25 7 26 6 27 9 21 2 21 25 4 22 27 5 26 15 3 18 6 21 7 35 1 24 2 21 6 15 29 18 9 22 3 23 5 25 7 12 25 1 15 2 21 5 17 6 22 3 334 5 307 4 297 8 280 6 280 3 284 1 352 4 359 8 369 8 341 5 327 376 6 331 9 362 3 362 5 279 6 287 7 333 3 418 7 364 4 331 2 285 6 304 3 367 5 330 309 4 245 5 358 4 291 317 314 326 1
Statistics
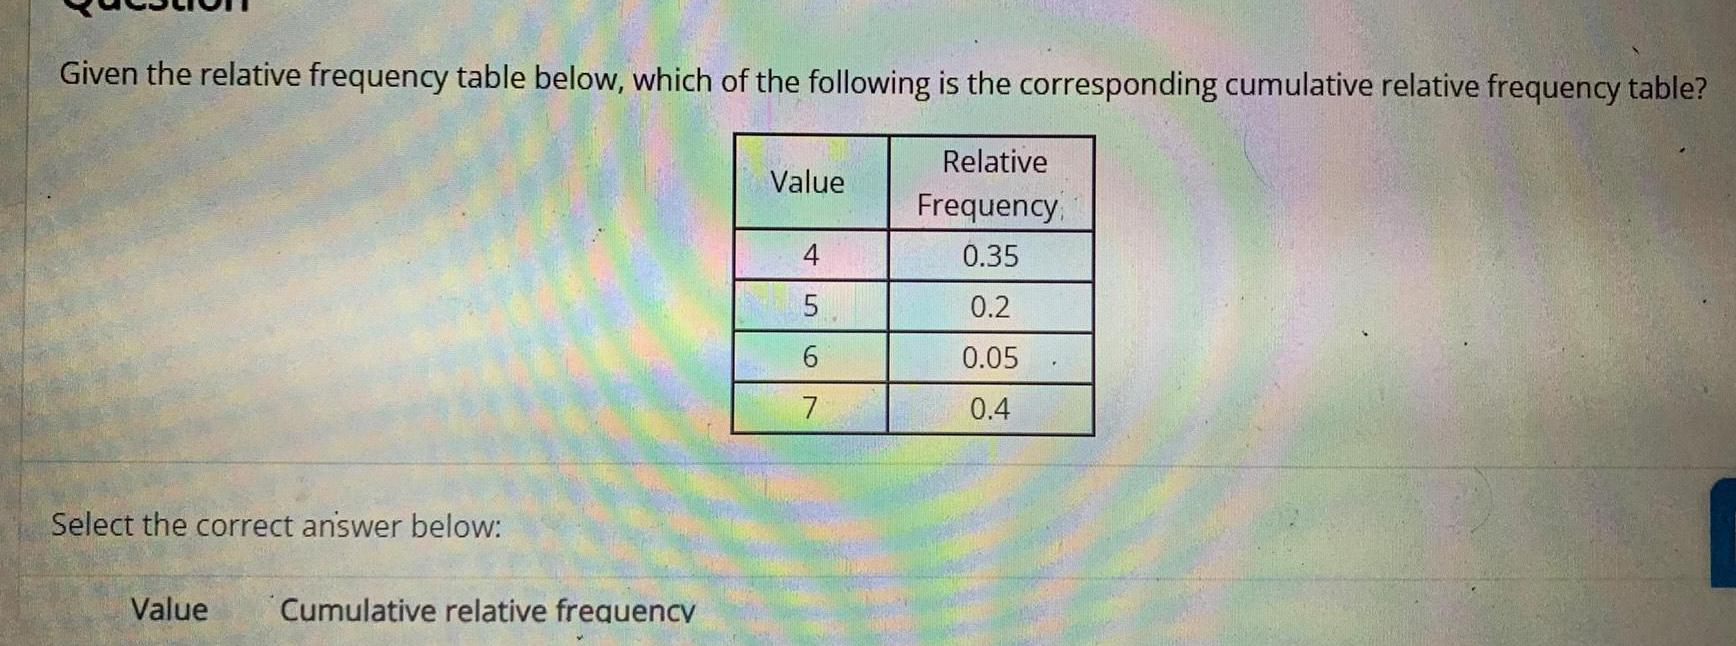
StatisticsGiven the relative frequency table below which of the following is the corresponding cumulative relative frequency table Relative Frequency 0 35 0 2 0 05 0 4 Select the correct answer below Value Cumulative relative frequency Value 4 5 6 7
Statistics
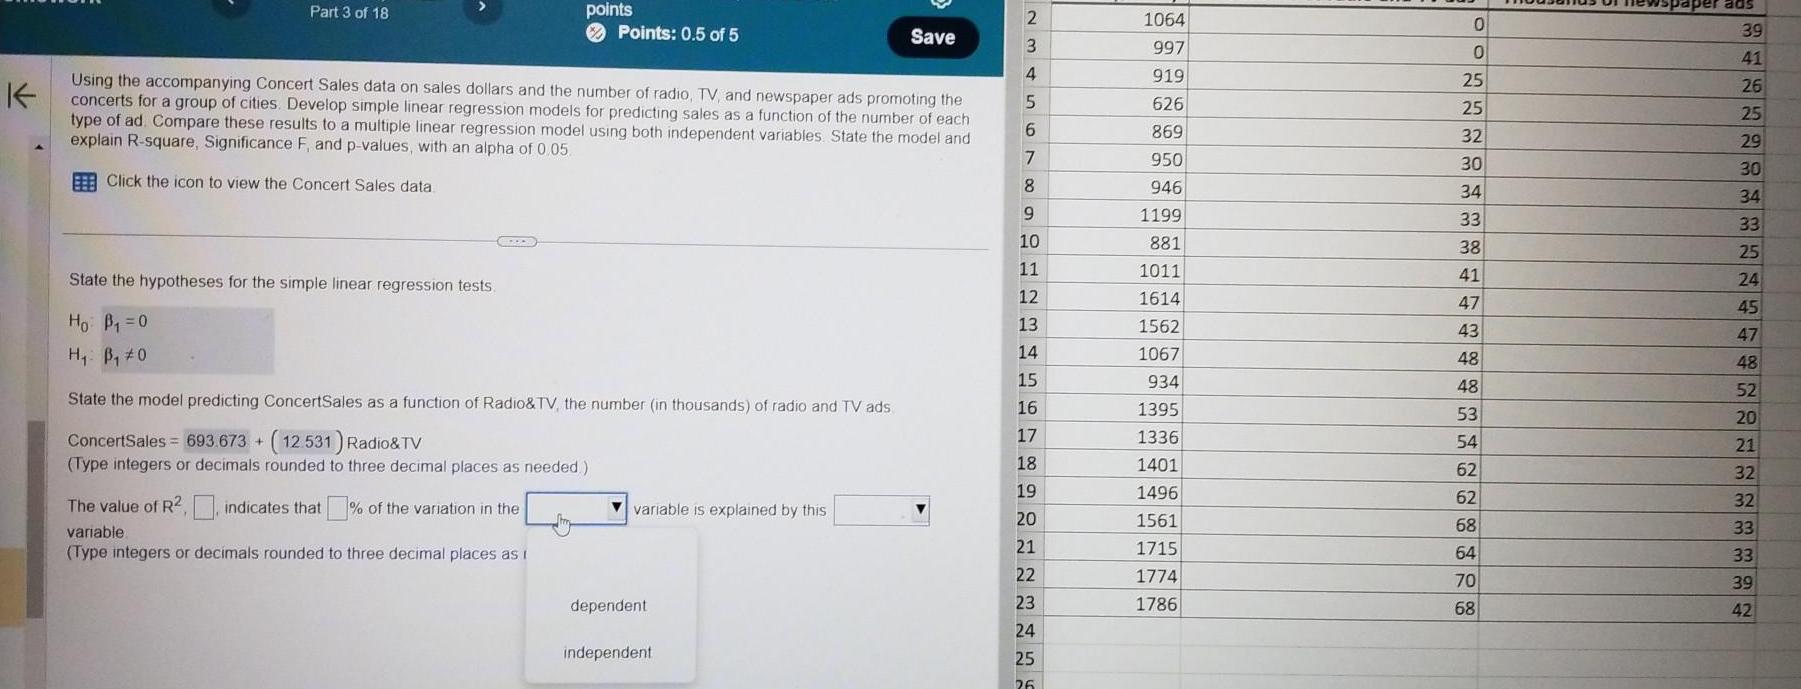
StatisticsPart 3 of 18 GEZER K Using the accompanying Concert Sales data on sales dollars and the number of radio TV and newspaper ads promoting the concerts for a group of cities Develop simple linear regression models for predicting sales as a function of the number of each type of ad Compare these results to a multiple linear regression model using both independent variables State the model and explain R square Significance F and p values with an alpha of 0 05 Click the icon to view the Concert Sales data State the hypotheses for the simple linear regression tests Ho B 0 H B 0 points Points 0 5 of 5 State the model predicting ConcertSales as a function of Radio TV the number in thousands of radio and TV ads ConcertSales 693 673 12 531 Radio TV Type integers or decimals rounded to three decimal places as needed The value of R indicates that of the variation in the R2 variable Type integers or decimals rounded to three decimal places as i variable is explained by this dependent Save independent 2 3 4 5 6 7 8 9 10 11 12 13 14 15 16 17 18 19 20 21 22 23 24 25 26 1064 997 919 626 869 950 946 1199 881 1011 1614 1562 1067 934 1395 1336 1401 1496 1561 1715 1774 1786 0 0 25 25 32 30 34 33 38 41 47 43 48 48 53 54 62 62 68 64 70 68 per ads 39 41 26 25 29 30 34 33 25 24 45 47 48 52 20 21 32 32 33 33 39 42

Statistics
ProbabilityA jury pool consists of 31 people 13 men and 18 women Compute the probability that a randomly selected jury of 12 people is all men P Jury of 12 is all men Express your answer as a fraction or a decimal including all the digits your calculator displays Briefly show the setup of your calculation
Statistics
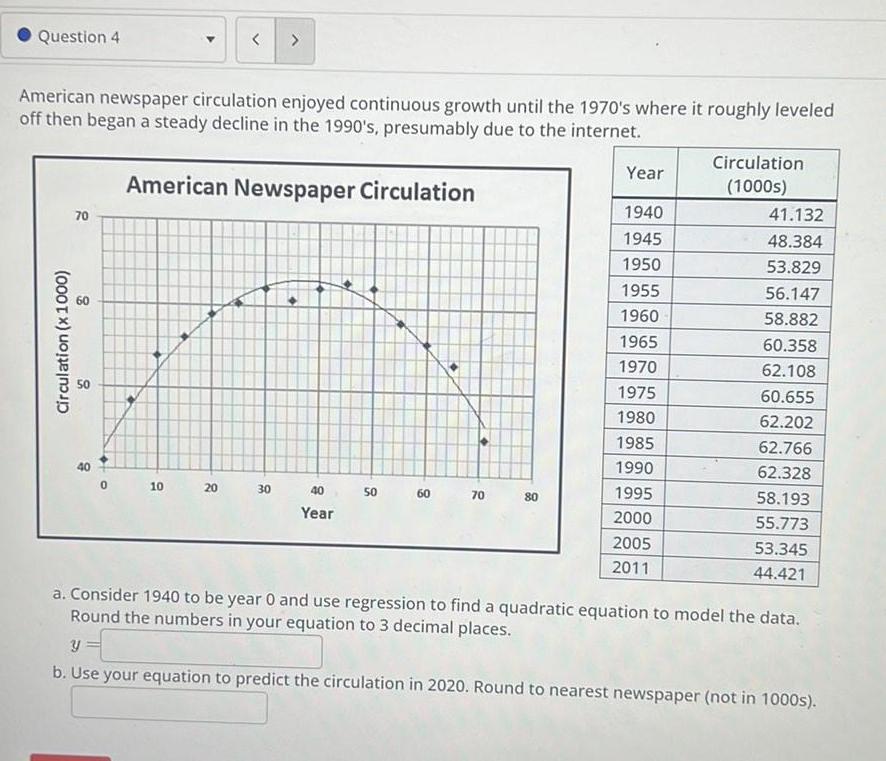
StatisticsQuestion 4 Circulation x1000 American newspaper circulation enjoyed continuous growth until the 1970 s where it roughly leveled off then began a steady decline in the 1990 s presumably due to the internet American Newspaper Circulation 70 8 10 20 30 40 Year 50 60 70 80 Year 1940 1945 1950 1955 1960 1965 1970 1975 1980 1985 1990 1995 2000 2005 2011 Circulation 1000s 41 132 48 384 53 829 56 147 58 882 60 358 62 108 60 655 62 202 62 766 62 328 58 193 55 773 53 345 44 421 a Consider 1940 to be year 0 and use regression to find a quadratic equation to model the data Round the numbers in your equation to 3 decimal places y b Use your equation to predict the circulation in 2020 Round to nearest newspaper not in 1000s
Statistics
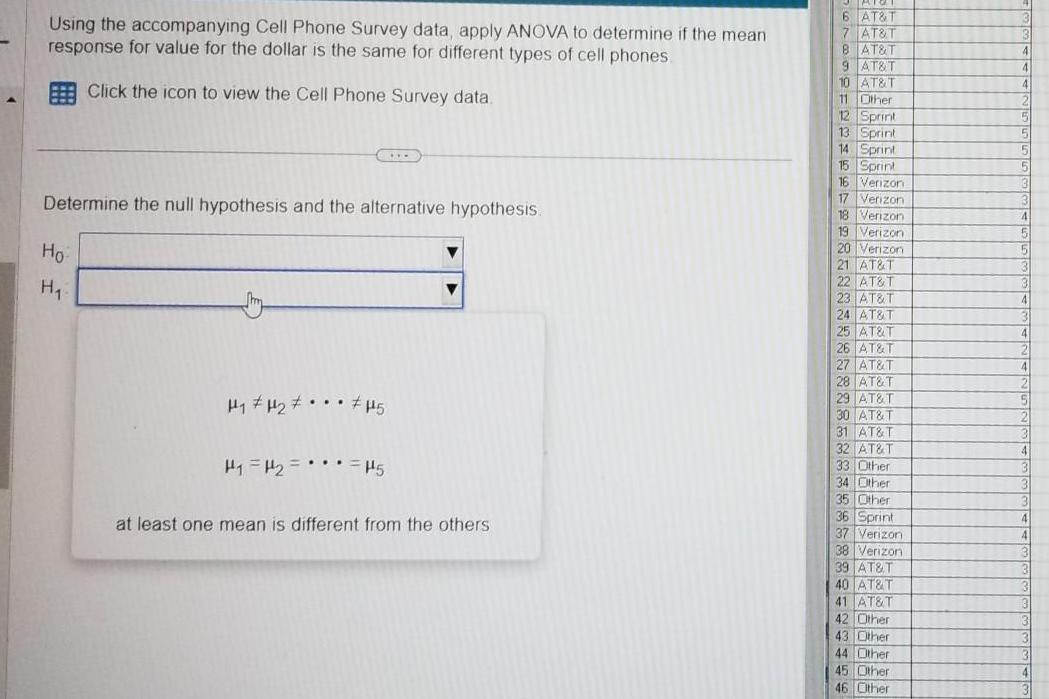
StatisticsUsing the accompanying Cell Phone Survey data apply ANOVA to determine if the mean response for value for the dollar is the same for different types of cell phones Click the icon to view the Cell Phone Survey data Determine the null hypothesis and the alternative hypothesis Ho H H H 5 H H H5 at least one mean is different from the others 6 AT T 7 AT T 8 AT T 9 AT T 10 AT T 11 Other 12 Sprint 13 Sprint 14 Sprint 15 Sprint expan 16 Verizon Verizon 17 18 Verizon 19 Verizon 20 Verizon 21 AT T 22 AT T 23 AT T 24 AT T 25 AT T 26 AT T 27 AT T 28 AT T 29 AT T 30 AT T 31 AT T 32 AT T 33 Other 34 Other 35 Other 36 Sprint 37 Verizon 38 Verizon 39 AT T 40 AT T 41 AT T 42 Other 43 Other 44 Other 45 Other 46 Other
Statistics
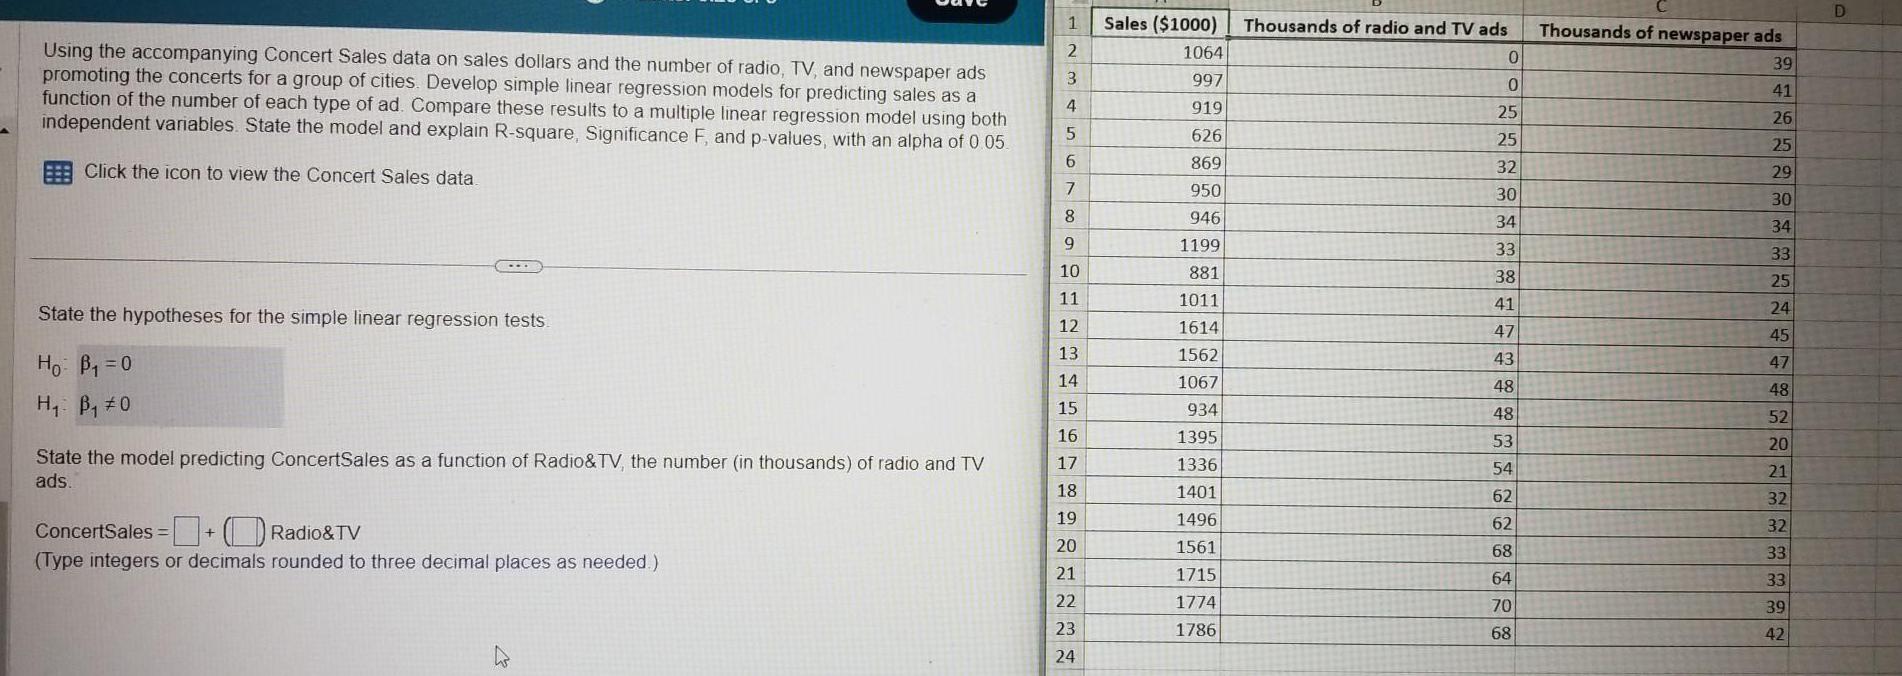
StatisticsUsing the accompanying Concert Sales data on sales dollars and the number of radio TV and newspaper ads promoting the concerts for a group of cities Develop simple linear regression models for predicting sales as a function of the number of each type of ad Compare these results to a multiple linear regression model using both independent variables State the model and explain R square Significance F and p values with an alpha of 0 05 Click the icon to view the Concert Sales data State the hypotheses for the simple linear regression tests Ho B 0 H B 0 State the model predicting ConcertSales as a function of Radio TV the number in thousands of radio and TV ads Concertsales Radio TV Type integers or decimals rounded to three decimal places as needed 1 Sales 1000 2 3 4 5 6 7 8 9 10 11 12 13 HELT Bg 14 15 16 17 18 19 20 21 22 23 24 1064 997 919 626 869 950 946 1199 881 1011 1614 1562 1067 934 1395 1336 1401 1496 1561 1715 1774 1786 Thousands of radio and TV ads 0 0 25 25 32 30 34 33 38 41 47 43 48 48 53 54 62 62 68 64 70 68 Thousands of newspaper ads 39 41 26 25 29 30 34 33 25 24 45 47 48 52 20 21 32 32 33 33 39 42 D
Statistics
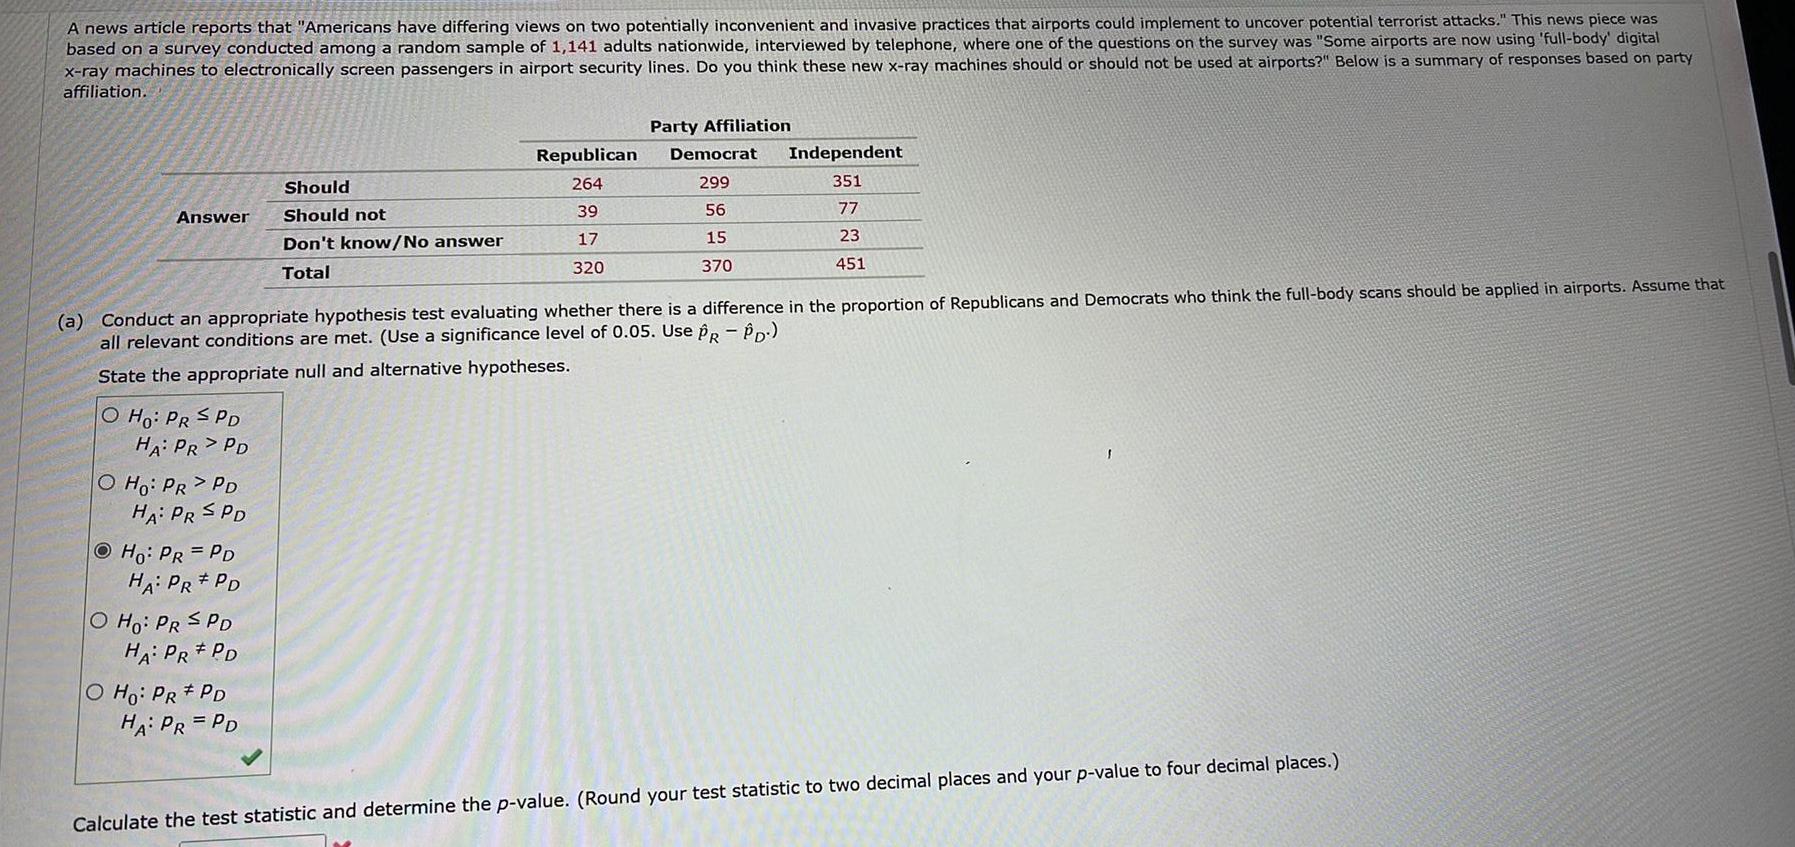
ProbabilityA news article reports that Americans have differing views on two potentially inconvenient and invasive practices that airports could implement to uncover potential terrorist attacks This news piece was based on a survey conducted among a random sample of 1 141 adults nationwide interviewed by telephone where one of the questions on the survey was Some airports are now using full body digital x ray machines to electronically screen passengers in airport security lines Do you think these new x ray machines should or should not be used at airports Below is a summary of responses based on party affiliation Answer O Ho PR SPD HA PR PD O Ho PR PD HA PR SPD Ho PR PD HA PR PD O Ho PR SPD HA PR PD Should Should not Don t know No answer Total O Ho PR PD HA PR PD Republican 264 39 17 320 a Conduct an appropriate hypothesis test evaluating whether there is a difference in the proportion of Republicans and Democrats who think the full body scans should be applied in airports Assume that all relevant conditions are met Use a significance level of 0 05 Use PR PD State the appropriate null and alternative hypotheses Party Affiliation Democrat 299 56 15 370 Independent 351 77 23 451 1 Calculate the test statistic and determine the p value Round your test statistic to two decimal places and your p value to four decimal places
Statistics
StatisticsAn airliner carries 50 passengers and has doors with a height of 78 in Heights of men are normally distributed with a mean of 69 0 in and a standard deviation of 2 8 in Complete parts a through d LL OB The probability from part b is more relevant because it shows the proportion of male passengers that will not need to bend OC The probability from part b is more relevant because it shows the proportion of flights where the mean height of the male passengers will be less than the door height OD The probability from part a is more relevant because it shows the proportion of male passengers that will not need to bend d When considering the comfort and safety of passengers why are women ignored in this case OA Since men are generally taller than women it is more difficult for them to bend when entering the aircraft Therefore it is more important that men not have to bend than it is important that women not have to bend OB There is no adequate reason to ignore women A separate statistical analysis should be carried out for the case of women OC Since men are generally taller than women a design that accommodates a suitable proportion of men will necessarily accommodate a greater proportion of women 2770 A
Statistics
Statisticsairliner carries 50 passengers and has doors with a height of 78 in Heights of men are normally distributed with a mean of 69 0 in and a standard deviation of 2 8 in Complete parts a through d GITTE c When considering the comfort and safety of passengers which result is more relevant the probability from part a or the probability from part b Why OA The probability from part a is more relevant because it shows the proportion of flights where the mean height of the male passengers will be less than the door height OB The probability from part b is more relevant because it shows the proportion of male passengers that will not need to bend OC The probability from part b is more relevant because I shows the proportion of flights where the mean height of the male passengers will be less than the door height OD The probability from part a is more relevant because shows the proportion of male passengers that will not need to bend
Statistics
StatisticsWhich of the following is NOT a conclusion of the Central Limit Theorem Choose the correct answer below OA The distribution of the sample data will approach a normal distribution as the sample size increases B The distribution of the sample means x will as the sample size increases approach a normal distribution OC The standard deviation of all sample means is the population standard deviation divided by the square root of the sample OD The mean of all sample means is the population mean
Statistics
StatisticsA researcher collects a simple random sample of grade point averages of statistics students and she calculates the mean of this sample Under what conditions can that sample mean be treated as a value from a population having a normal distribution Select all that apply A The sample has more than 30 grade point averages B If the population of statistics students has a normal distribution C If the population of grade point averages has a normal distribution D The researcher collects more than 30 samples XITE
Statistics
StatisticsSuppose that you have two sets of data to work with The first set is a list of all the injuries that were seen in a clinic in a month s time The second set contains data on the number of minutes that each patient spent in the waiting room of a doctor s office You can make assumptions about other information or variables that are included in each data set For each data set propose your idea of how best to represent the key information To organize your data would you choose to use a frequency table a cumulative frequency table or a relative frequency table Why What type of graph would you use to display the organized data from each frequency distribution What would be shown on each of the axes for each graph Follow Up Post Instructions Respond to at least one peer Further the dialogue by providing more information and clarification Consider how different distributions might affect the different graphs How might other variables affect the graphs How could graphs be made to be biased If a graph were biased how might you change it to guard against that bias
Statistics
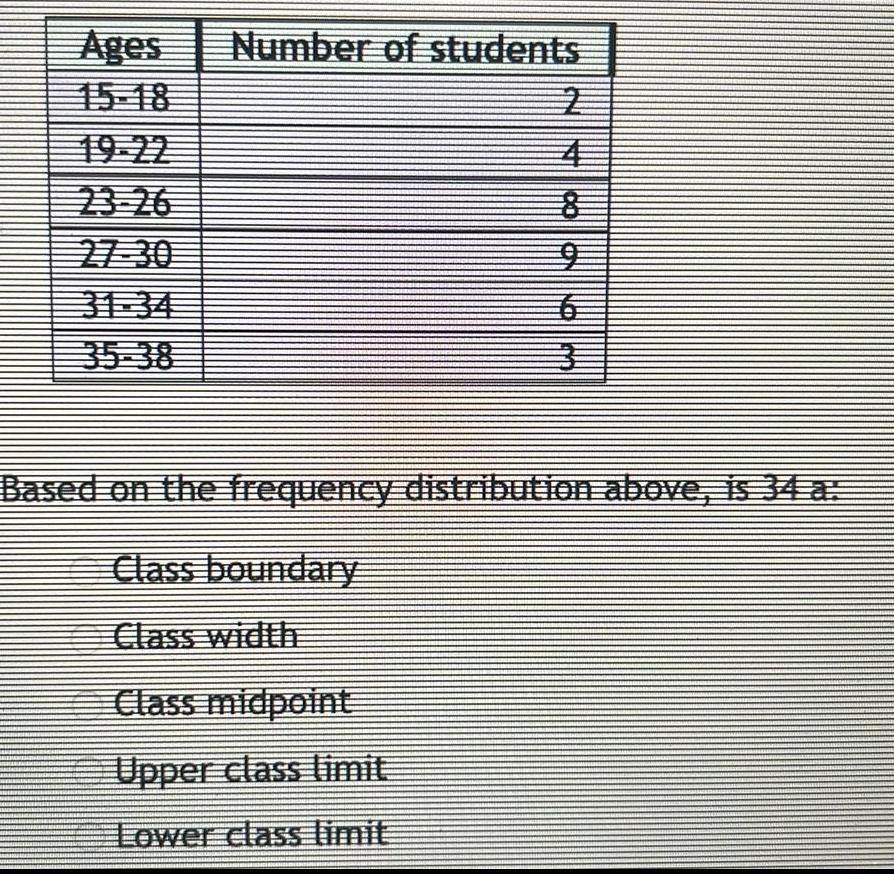
StatisticsAges Number of students 2 31 34 3 Based on the frequency distribution above is 34 a Class boundary Class width Class midpoint Upper class limit Lower class limit
Statistics
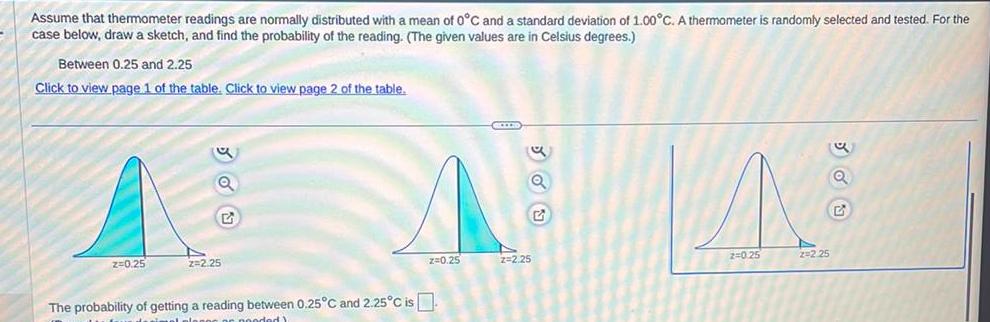
StatisticsAssume that thermometer readings are normally distributed with a mean of 0 C and a standard deviation of 1 00 C A thermometer is randomly selected and tested For the case below draw a sketch and find the probability of the reading The given values are in Celsius degrees Between 0 25 and 2 25 Click to view page 1 of the table Click to view page 2 of the table z 0 25 Q 2 2 25 E The probability of getting a reading between 0 25 C and 2 25 C is nonooded z 0 25 GELED Q Z 2 25 G A 2 0 25 z 2 25
Statistics
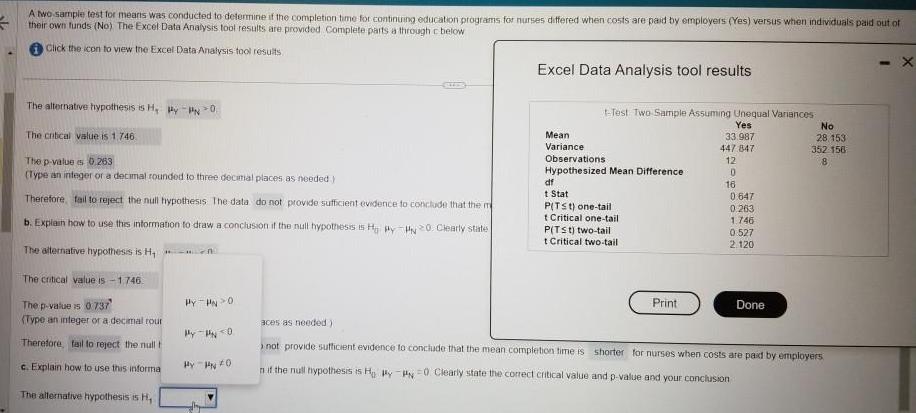
Statistics54 A two sample test for means was conducted to determine if the completion time for continuing education programs for nurses differed when costs are paid by employers Yes versus when individuals paid out of their own funds No The Excel Data Analysis tool results are provided Complete parts a through c below Click the icon to view the Excel Data Analysis tool results The alternative hypothesis is H PyPN 0 The critical value is 1 746 The p value es 0 263 Type an integer or a decimal rounded to three decimal places as needed Therefore fail to reject the null hypothesis The data do not provide sufficient evidence to conclude that the m 20 Clearly state b Explain how to use this information to draw a conclusion if the null hypothesis is Hy The alternative hypothesis is H The critical value is 1 746 The p value is 0737 Type an integer or a decimal rour Therefore fail to reject the null t c Explain how to use this informa The alternative hypothesis is H HY HNO Hy 0 Hy PN 0 Excel Data Analysis tool results t Test Two Sample Assuming Unequal Variances Yes 33 987 447 847 12 0 16 Mean Variance Observations Hypothesized Mean Difference df t Stat PITS t one tail t Critical one tail P Tst two tail t Critical two tail Print 0 647 0 263 1 746 0 527 2 120 Done No 28 153 352 156 8 aces as needed not provide sufficient evidence to conclude that the mean completion time is shorter for nurses when costs are paid by employers n if the null hypothesis is Hy P 0 Clearly state the correct critical value and p value and your conclusion X
Statistics
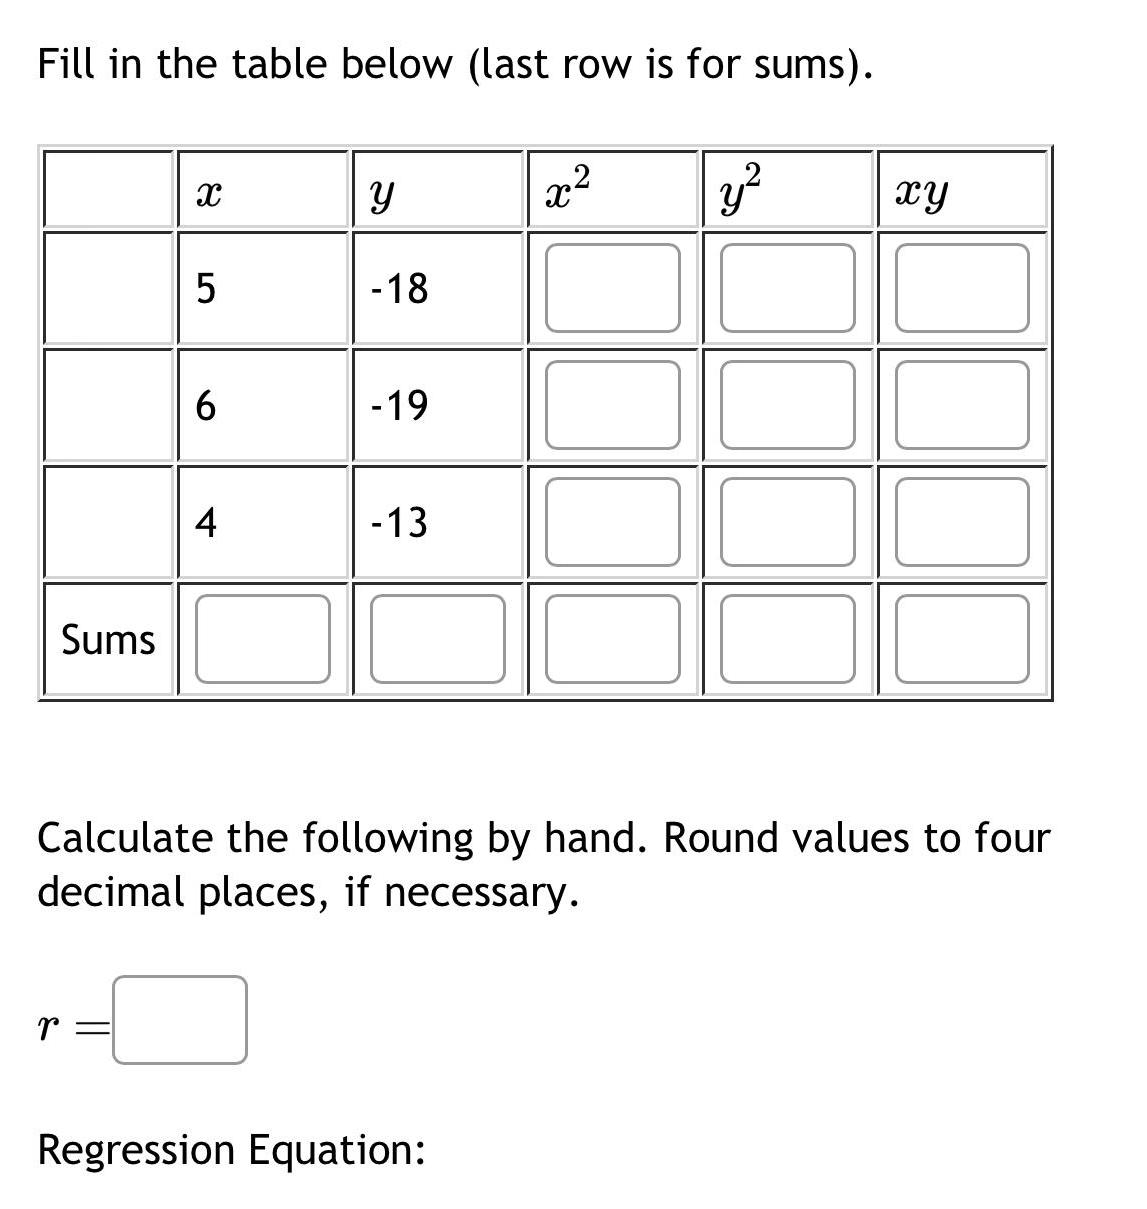
StatisticsFill in the table below last row is for sums Sums X r 5 6 4 Y 18 19 13 x Regression Equation y Calculate the following by hand Round values to four decimal places if necessary xy
Statistics
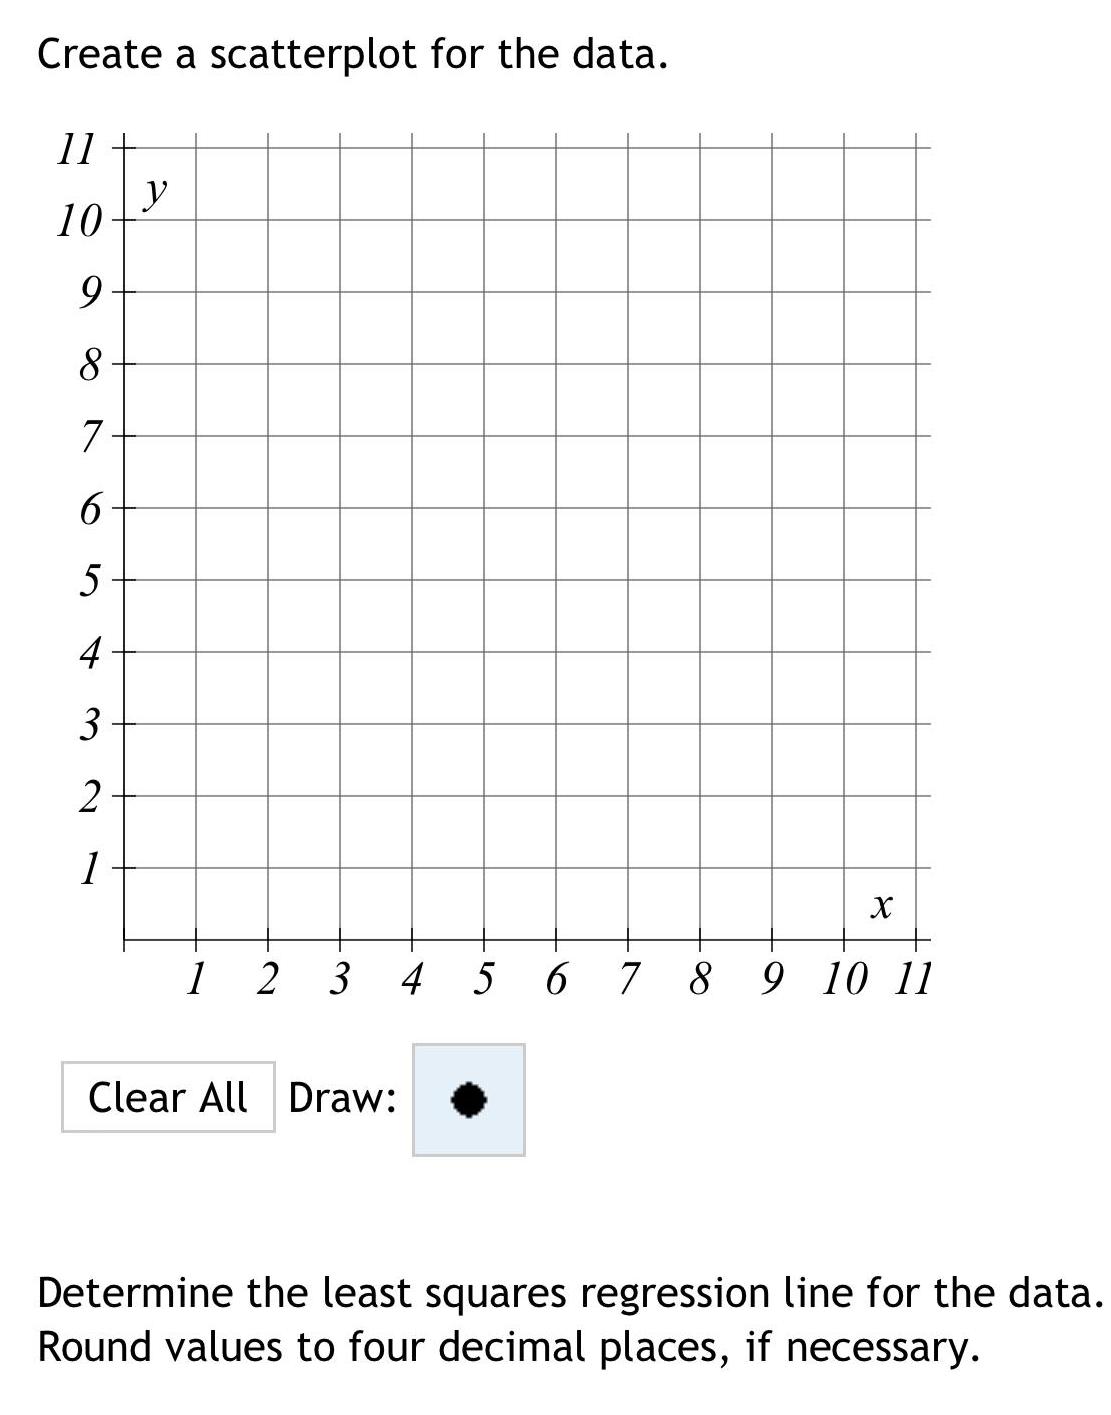
StatisticsCreate a scatterplot for the data 11 10 9 8 7 6 5 4 3 2 1 y X 1 2 3 4 5 6 7 8 9 10 11 Clear All Draw Determine the least squares regression line for the data Round values to four decimal places if necessary

Statistics
StatisticsThe given quantities below were calculated from a sample data set x 265 x 3685 m y y 266 L 3434 xy xy 2621 Determine the least squares regression line Round values to four decimal places if necessary n 29 Determine the correlation coefficient Round the solution to four decimal places if necessary