Statistics Questions
The best high school and college tutors are just a click away, 24×7! Pick a subject, ask a question, and get a detailed, handwritten solution personalized for you in minutes. We cover Math, Physics, Chemistry & Biology.

Statistics
ProbabilityK Determine the point estimate of the population mean and margin of error for the confidence interval with lower bound of 22 and upper bound of 44 OA X 33 E 22 OB X 33 E 11 OC X 44 E 11 OD X 22 E 22 m

Statistics
ProbabilityIf 8cos 0 4 12 where 0 0 2 what are the values of 0 List your answers as exact answers in terms of it separated by a comma if necessary Provide your answer below

Statistics
StatisticsK Find the margin of error for the given values of c s and n c 0 98 s 5 n 9 Click the icon to view the t distribution table The margin of error is Round to three decimal places as needed t Distribution Table d f 1 2 3 4 5 6 7 8 9 10 11 12 13 14 15 16 17 18 Level of confidence c One tail a Two tails a This quiz 12 point s possible This question 1 point s possible D 0 80 0 90 0 95 0 98 0 99 0 10 0 05 0 025 0 01 0 005 0 20 0 10 0 05 0 02 0 01 3 078 6 314 12 706 31 821 63 657 1 886 2 920 4 303 6 965 9 925 1 638 2 353 3 182 4 541 5 841 1 533 2 132 2 776 3 747 4 604 1 476 2 015 2 571 3 365 4 032 1 440 1 943 2 447 3 143 3 707 1 415 1 895 2 365 2 998 3 499 d f 1 2 3 4 5 6 7 1 397 1 860 2 306 2 896 3 355 8 1 383 1 833 2 262 2 821 3 250 9 1 372 1 812 2 228 2 764 3 169 10 1 363 1 796 2 201 2 718 3 106 11 1 356 1 782 2 179 2 681 3 055 12 1 350 1 771 2 160 2 650 3 012 13 1 345 1 761 2 145 2 624 2 977 14 1 341 1 753 2 131 2 602 2 947 15 1 337 1 746 2 120 2 583 2 921 16 1 333 1 740 2 110 2 567 2 898 17 1 330 1 734 2 101 2 552 2 878 18 2530 2061 10

Statistics
StatisticsIn a survey of 2337 adults 744 say they believe in UFOs Construct a 90 confidence interval for the population proportion of adults who believe in UFOs A 90 confidence interval for the population proportion is Round to three decimal places as needed Interpret your results Choose the correct answer below A The endpoints of the given confidence interval shows that 90 of adults believe in UFOs B With 90 confidence it can be said that the sample proportion of adults who believe in UFOs is between the endpoints of the given confidence interval OC With 90 confidence it can be said that the population proportion of adults who believe in UFOs is between the endpoints of the given confidence interva D With 90 probability the population proportion of adults who do not believe in UFOs is between the endpoints of the given confidence interval

Statistics
StatisticsSuppose that diameters of a new species of apple have a bell shaped distribution with a mean of 7 2 cm and a standard deviation of 0 38 cm Using the empirical rule what percentage of the apples have diameters that are less than 6 44 cm Please do not round your answer

Statistics
StatisticsQuestion 8 of This question 1 point s In a random sample of 28 families the average weekly food expense was 95 60 with a standard deviation of 22 50 Determine whether a normal distribution or a t distribution should be used or whe neither of these can be used to construct a confidence interval Assume the distribution of weekly food expenses is normally shaped OA Use normal distribution B Cannot use normal distribution or t distribution OC Use the t distribution

Statistics
StatisticsK This question 1 point s possible Determine the point estimate of the population mean and margin of error for the confidence interval with lower bound of 22 and upper bound of 44 OA x 33 E 22 OB X 33 E 11 OC x 44 E 11 O D X 22 E 22 SID

Statistics
StatisticsThis question 1 point s poss When estimating a population mean are you more likely to be correct when you use a point estimate or an interval estimate Explain your reasoning Choose the correct answer below OA You are more likely to be correct using a point estimate because an interval estimate is too broad and contains many possible values OB If n 30 an interval estimate is more accurate If n 30 a point estimate is more accurate OC You are more likely to be correct using an interval estimate because it is unlikely that a point estimate will exactly equal the population mean OD There is no difference between an interval estimate and a point estimate in terms of accuracy

Statistics
Probability33 When playing roulette at a casino a gambler is trying to decide whether to bet 20 on the number 15 or to bet 20 that the outcome is any one of the five possibilities 00 0 1 2 or 3 The gambler 38 knows that the expected value of the 20 bet for a single number is 1 05 For the 20 bet that the outcome is 00 0 1 2 or 3 there is a probability of of making a net profit of 100 and a probability of losing 20 38 a Find the expected value for the 20 bet that the outcome is 00 0 1 2 or 3 b Which bet is better a 20 bet on the number 15 or a 20 bet that the outcome is any one of the numbers 00 0 1 2 or 3 Why a The expected value is Round to the nearest cent as needed b Since the expected value of the bet on the number 15 is COCOS than the expected value for the bet that the outcome is 00 0 1 2 or 3 the bet on is better

Statistics
StatisticsUse Newton s method with the specified initial approximation x to find x3 the third approximation to the solution of the given equation Round your answer to four decimal places 2x 3x 2 0 x 1 x3

Statistics
ProbabilityMultiple choice questions each have four possible answers a b c d one of which is correct Assume that you guess the answers to three such questions a Use the multiplication rule to find P WWC where C denotes a correct answer and W denotes a wrong answer P WWC Type an exact answer b Beginning with WWC make a complete list of the different possible arrangements of one correct answer and two wrong answers then find the probability for each entry in the list P WWC see above P WCW P CWW Type exact answers c Based on the preceding results what is the probability of getting exactly one correct answer when three guesses are made Type an exact answer

Statistics
StatisticsFor the binomial distribution which formula finds the standard deviation Choose the correct answer below Onp Onpq O npq np

Statistics
Statisticsfer to the accompanying table which describes the number of adults in groups of five who reported sleepwalking Find the mean and standard five Click the icon to view the data table The mean is sleepwalker s Round to one decimal place as needed The standard deviation is sleepwalker s Round to one decimal place as needed Table of numbers of sleepwalkers and probabilities X012345 1 P x 0 180 0 362 0 298 0 124 0 034 0 002 X

Statistics
StatisticsK Using the accompanying Accounting Professionals data to answer the following questions a Find and interpret a 99 confidence interval for the mean years of service b Find and interpret a 99 confidence interval for the proportion of employees who have a graduate degree Click the icon to view the Accounting Professionals data OA limits OB We are 99 confident that the sample mean years of service will be between the confidence interval limits Oc Of all the data values 99 of the population will fall between the confidence interval limits We are 99 confident that the population mean years of service will be between the confidence interval D limits b A 99 confidence interval for the proportion of employees who have a graduate degree is 0 163 0 737 Use ascending order Round to two decimal places as needed Interpret the confidence interval Choose the correct answer below OA We are 99 confident that the population proportion of employees who have a graduate degree will be between the confidence interval limits O B We are 99 confident that the population proportion of employees who have a graduate degree will be lie outside the confidence interval limits O c Of all the data values 99 of the population will fall between the confidence interval limits There is a 99 chance that the population proportion of employees who have a graduate degree will be OD between the confidence interval limits 1 2 3 4 5 6 7 8 9 10 11 12 13 14 15 16 17 18 19 20 21 22 23 24 25 26 27 28 29 20 A B Employee Years of Service 1 2 3 4 5 6 7 8 9 10 11 12 13 14 15 16 17 18 19 20 19 Y 9 Y 9 N 14 Y 8 Y 26 Y 8 Y 20 N 10 N 10 N 6 N 8 N Graduate Degree 16 Y 21 N 26 N 19 Y 28 N 17 N 8 Y 31 N C

Statistics
StatisticsSaved If we wanted to generate a set of random values within SQL what function could wel use to achieve that rdm rand random rndm

Statistics
Probability11 Suppose babies born after a gestation period of 32 to 35 weeks have a mean weight of 2800 grams and a standard deviation of 700 grams while babies born after a gestation period of 40 weeks have a mean weight of 3200 grams and a standard deviation of 530 grams If a 34 wee gestation period baby weighs 2400 grams and a 41 week gestation period baby weighs 2800 grams find the corresponding z scores Which baby weighs less relative to the gestation period Find the corresponding z scores Which baby weighs relatively less Select the correct choice below and fill in the answer boxes to complete your choice Round to two decimal places as needed OA The baby born in week 41 weighs relatively less since its z score for the baby born in week 34 the z score of OB The baby born in week 41 weighs relatively less since its z score the z score of for the baby born in week 34 OC The baby born in week 34 weighs relatively less since its z score the z score of for the baby born in week 41 OD The baby born in week 34 weighs relatively less since its z score is smaller than is larger than is smaller than is larger than

Statistics
StatisticsDetermine the leaves in the stem and leaf plot below Key 313 33 Income millions 3 3 4 5 5 6 35 36 44 50 35 56 56 66 45 63 46 37 76 45 34 44 43 81 53 38 73 34 38 85 34 53 41 42 45 58 6

Statistics
Probabilityy was conducted that asked 1003 people how many books they had read in the indicated that x 12 8 books and s 16 6 books Construct a 90 confidence an number of books neople read Interpret the interval If repeated samples are taken 90 of them will have a sample mean between There is a 90 probability that the true mean number of books read is between There is 90 confidence that the population mean number of books read is bet and

Statistics
Statisticsaccompanying data represent the miles per g lle ree cylinder 1 0 liter engine Compute the z score corresponding to the individual who obtained 38 2 miles per ga erpret this result and indicates that the data value is e z score corresponding to the individual is andard deviation s the ype integers or decimals rounded to two decimal places as needed

Statistics
Statisticse accompanying data represent the miles per gallon of a random sample of cars with hree cvlinder 10 liter engine e upper fence is pe integers or decimals Do not round there any outliers Select the correct choice below and if necessary fill in the answer b mplete your choice A The outlier s is are Type an integer or a decimal Do not round Use a comma to separate answers as needed OB There are no outliers

Statistics
Statisticsaccompanying data represent the miles per gallon of a random sample ee cylinder 1 0 liter engine etermine the quartiles mpg mpg mpg

Statistics
ProbabilityA university conducted a survey of 383 undergraduate students regarding satisfaction with student government Results of the survey are shown in the table by class rank Complete parts a through d below Satisfied Neutral Not satisfied Total Freshman 60 28 16 104 Sophomore 46 19 21 86 a If a survey participant is selected at random what is the probability that he or she is satisfied with student government P satisfied Round to three decimal places as needed b If a survey participant is selected at random what is the probability that he or she is a junior P junior Round to three decimal places as needed P satisfied and junior Round to three decimal places as needed P satisfied or junior Reuss Junior Senior 67 60 10 15 19 96 c If a survey participant is selected at random what is the probability that he or she is satisfied and a junior 22 97 mal pla d If a survey participant is selected at random what is the probability that he or she is satisfied or a junior pooded Y Total 233 72 78 383

Statistics
Probabilitydents who first enrolled in two year public institutions in a recent semester the ned a bachelor s degree within six years was 0 387 The president of a certain believes that the proportion of students who enroll in her institution have a hig tion rate tegers or decimals Do not round at would it mean to make a Type Il error the hypothesis that the proportion of students who earn when in fact the proportion esident lor s degree within six years is ntegers or decimals Do not round

Statistics
Statisticso H100 versus H 100 a simple random sample size of n 17 is obtained fro on that is known to be normally distributed Answer parts a d e researcher reject the funnypotes The researcher will reject the null hypothesis since the test statistic is not between the critical values There is not sufficient evidence for the researcher to reject the null hypothesis since t est statistic is between the critical values There is not sufficient evidence for the researcher to reject the null hypothesis since th est statistic is not between the critical values The researcher will reject the null hypothesis since the test statistic is between the criti walues

Statistics
Statisticsor students who first enrolled in two year public institutions in a recent semester the propor no earned a bachelor s degree within six years was 0 387 The president of a certain junior llege believes that the proportion of students who enroll in her institution have a higher mpletion rate DA Among students who enroll at the certain junior college the completion rate is 0 387 OB Among students who first enroll in two year public institutions the completion rate is 0 387 OC Among students who enroll at the certain junior college the completion rate is less tha 0 387 OD Among students who enroll at the certain junior college the completion rate is greater than 0 387

Statistics
Statisticse hypothesis using the P value approach Be sure to verify the requirements of p 0 6 versus H p 0 6 125 x 80 a 0 01 e the correct result of the hypothesis test for the P value approach below Do not reject the null hypothesis because the P value is greater than a Do not reject the null hypothesis because the P value is less than a Reject the null hypothesis because the P value is greater than x Reject the null hypothesis because the P value is less than a

Statistics
StatisticsThe mean value of land and buildings per acre from a sample of farms is 1200 with a standard deviation of 200 The data set has a bell shaped distribution Using the empirical rule determine which of the following farms whose land and building values per acre are given are unusual more than two standard deviations from the mean Are any of the data values very unusual more than three standard deviations from the mean 1147 1763 1598 459 1420 1570 Which of the farms are unusual more than two standard deviations from the mean Select all that apply A 1147 B 459 C 1763 D 1420 E 1570 F 1598 Which of the farms are very unusual more than three standard deviations from the mean Select all that apply A 459 B 1570 C 1598 D 1420 E 1763 F 1147

Statistics
Probabilityse a simple random sample of size n 150 is obtained from a population whose size 000 and whose population proportion with a specified characteristic is p 0 8 Compl through c below at is the probability of obtaining x 126 or more individuals with the characteristic The P p 0 84 84 Round to four decimal places as needed at is the probability of obtaining x 111 or fewer individuals with the characteristic The P p 0 74 74 Round to four decimal places as needed

Statistics
ProbabilityThe data show the number of vacation days used by a sample of 20 employees in a recent year Use technology to answer parts a and b a Find the data set s first second and third quartiles b Draw a box and whisker plot that represents the data set 10 399 39 1 9 8 7 7 3 6 0 8 8 3 5 390 a Find the three quartiles Q Q Q3 Type integers or decimals Do not round b Choose the correct answer plot below Note that different technologies will produce slightly different results O A 3 co 6 O 9 OB 0 3 6 9 O C

Statistics
Statisticsing to a study done by Nick Wilson of Otago University Wellington the probab nly selected individual will not cover his or her mouth when sneezing is 0 267 bench in a mall and observe people s habits as they sneeze Complete parts ng the binomial distribution what is the probability that among 12 randomly ed individuals exactly 7 do not cover their mouth when sneezing obability is to four decimal places as needed ng the binomial distribution what is the probability that among 12 randomly ed individuals fewer than 5 do not cover their mouth when sneezing bability is to four decimal places as needed

Statistics
Probabilityording to a study done by Nick Wilson of Otago University Wellington the probability a domly selected individual will not cover his or her mouth when sneezing is 0 267 Suppose on a bench in a mall and observe people s habits as they sneeze Complete parts a Using the binomial distribution what is the probability that among 12 randomly erved individuals fewer than 5 do not cover their mouth when sneezing probability is und to four decimal places as needed Using the binomial distribution would you be surprised if after observing 12 individuals fe half covered their mouth when sneezing Why be surprising because the probability is which is it 0 0

Statistics
Statisticsrmine the t value in each of the cases nd the t value such that the area in the right tail is 0 15 with 30 degrees of freed Round to three decimal places as needed nd the t value such that the area in the right tail is 0 20 with 30 degrees of freed Round to three decimal places as needed nd the t value such that the area left of the t value is 0 01 with 15 degrees of fre symmetry Round to three decimal places as needed nd the critical t value that corresponds to 80 confider

Statistics
Statisticsose a simple random sample of size n 150 is obtained from a population whos 5 000 and whose population proportion with a specified characteristic is p 0 8 a through c below scribe the sampling distribution of p se the phrase that best describes the shape of the sampling distribution below Approximately normal because n 0 05N and np 1 p 10 Not normal because n 0 05N and np 1 p 10 Not normal because n 0 05N and np 1 p 2 10 Approximately normal because n 0 05N and np 1 p 10

Statistics
Statisticswho first enrolled in two year public institutions in a recent semester th a bachelor s degree within six years was 0 387 The president of a certa eves that the proportion of students who enroll in her institution have a h ate ing students who enroll at the certain junior college the completion rate 7 ng students who enroll at the certain junior college the completion rate 0 387 ng students who first enroll in two year public institutions the completion 7 ing students who enroll at the certain junior college the completion rate

Statistics
Statisticscording to an almanac 60 of adult smokers started smoking before turning 18 years Would it be unusual to observe 340 smokers who started smoking before turning 18 y a random sample of 400 adult smokers O A Yes because 340 is greater than 20 OB No because 340 is between 20 and 20 O C No because 340 is less than 2o OD No because 340 is greater than 20 OE Yes because 340 is between 20 and 20

Statistics
StatisticsK insurance private or government in 2018 Approximate the mean and standard deviation 35 44 Age Number millions 33 5 25 34 20 3 0 H Type an integer or decimal rounded to two decimal places as needed 45 54 39 6 nl plonon no 55 64 26 2

Statistics
Statisticsversus H 7100 a simple random sample size ulation that is known to be normally distributed Answer parts a d 25 is obtained x 104 and s 8 6 compute the test statistic Round to three decimal places as needed f the researcher decides to test this hypothesis at the a 0 01 level of significance de critical values critical values are e a comma to separate answers as needed Round to three decimal places as needed

Statistics
StatisticsCritical r Fifty four wild bears were anesthetized and then their weights and chest sizes were measured and listed in a data set Results are shown in the accompanying display Is there sufficient evidence to support the claim that there is a linear correlation between the weights of bears and their chest sizes When measuring an anesthetized bear is it easier to measure chest size than weight If so does it P value two tailed 0 000 appear that a measured chest size can be used to predict the weight Use a significance level of 0 05 Correlation Results Correlation coeff r 0 971953 0 2680855 Is there sufficient evidence to support the claim that there is a linear correlation between the weights of bears and their chest sizes Choose the correct answer below and if necessary fill in the answer box within your choice Round to three decimal places as needed OA No because the test statistic OB Yes because the test statistic OC Yes because the absolute value of the test statistic OD No because the absolute value of the test statistic E The answer cannot be determined from the given information falls between the critical values falls between the critical values exceeds the critical value exceeds the critical value

Statistics
Statisticsmine whether the scatter diagram indicates inear relation may exist between the two es If the relation is linear determine er it indicates a positive or negative ation between the variables is information to answer the following Response 30 20 10 04 two variables have a positive or a negative association The two variables have a positive association The two variables have a negative association None of the above 20 Explanatory

Statistics
Probabilityhine whether the scatter diagram indicates inear relation may exist between the two es If the relation is linear determine er it indicates a positive or negative ation between the variables s information to answer the following two variables nave a linear relationship The data points have a linear relationship because they lie mainly in a straight line The data points have a linear relationship because they do not lie Response 30 20 10 04 OB 20 Explanatory 40 ha The data points do relationship because they mainly in a straight line D The data points do not ha relationship because they

Statistics
Probabilitygreater than less than or approximately equal to the median 10 Justify your answer 8 6 4 A x M because the histogram is symmetric OC x M because the histogram is skewed right E X M because the histogram is B x M because the histogram skewed left OD x M because the histogram skewed right F x M because the histogram

Statistics
Statisticsplete parts a through c below etermine the critical value s for a right tailed test of a population mean at the a nificance with 15 degrees of freedom etermine the critical value s for a left tailed test of a population mean at the a ficance based on a sample size of n 20 etermine the critical value s for a two tailed test of a population mean at the a ficance based on a sample size of n 14 rit rit Round to three decimal places as needed Round to three decimal places as needed

Statistics
StatisticsIn a survey conducted by a wedding planning website 1179 married or engaged women were asked about the importance of a bended knee when making a marriage proposal Among the 1179 respondents 62 said that the bended knee was essential Complete parts a through d a What is the exact value that is 62 of 1179 survey respondents The exact value is Type an integer or a decimal Do not round b Could the result from part a be the actual number of survey respondents who said that a bended knee is essential Why or why not O A No the result from part a could not be the actual number of survey respondents who said this because a count of people must result in a whole number OB No the result from part a could not be the actual number of survey respondents who said this because that is a very rare outcome OC Yes the result from part a could be the actual number of survey respondents who said this because the polling numbers are accurate OD Yes the result from part a could be the actual number of survey respondents who said this because the result is statistically significant c What is the actual number of survey respondents saying that the bended knee is essential The actual number of survey respondents with this response is Round to the nearest whole number as needed
Statistics
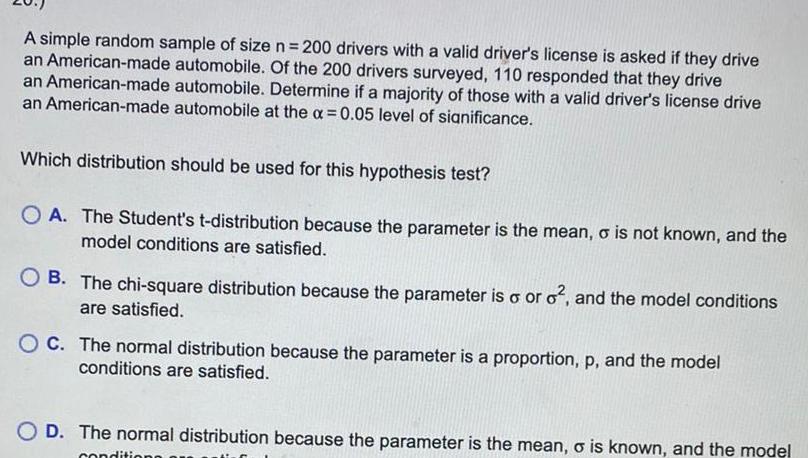
ProbabilityA simple random sample of size n 200 drivers with a valid driver s license is asked if they drive an American made automobile Of the 200 drivers surveyed 110 responded that they drive an American made automobile Determine if a majority of those with a valid driver s license drive an American made automobile at the a 0 05 level of significance Which distribution should be used for this hypothesis test OA The Student s t distribution because the parameter is the mean o is not known and the model conditions are satisfied OB The chi square distribution because the parameter is o or o and the model conditions are satisfied OC The normal distribution because the parameter is a proportion p and the model conditions are satisfied O D The normal distribution because the parameter is the mean o is known and the model

Statistics
ProbabilityA group of adult males has foot lengths with a mean of 27 17 cm and a standard deviation of 1 39 cm Use the range rule of thumb for identifying significant values to identify the limits separating values that are significantly low or significantly high Is the adult male foot length of 30 3 cm significantly low or significantly high Explain Type an integer or a decimal Do not round Select the correct choice below and fill in the answer box es to complete your choice The adult male foot length of 30 3 cm is significantly high because it is greater than Type an integer or a decimal Do not round OA OB CITE C The adult male foot length of 30 3 cm is significantly low because it is less than Type an integer or a decimal Do not round The adult male foot length of 30 3 cm is not significant because it is between Type integers or decimals Do not round cm cm cm and cm

Statistics
Probability20 A golf association requires that golf balls have a diameter that is 1 68 inches To determine if golf balls conform to the standard a random sample of golf balls was selected Their diameters are shown in the accompanying data table Do the golf balls conform to the standards Use the x 0 01 level of significance Golf Ball Diameter inches 1 683 1 686 1 684 1 685 1 676 1 677 1 685 1 682 What can be concluded from the hypothesis test 1 682 1 685 1 673 1 674 O A Do not reject Ho There is sufficient evidence to conclude that the golf balls do not conform to the association s standards at the x 0 01 level of significance OB Reject Ho There is not sufficient evidence to conclude that the golf balls do not conform to the association s standards at the a 0 01 level of significance OC Do not reject Ho There is not sufficient evidence to conclude that the golf balls do not conform to the association s standards at the a 0 01 level of significance O D Reject Ho There is sufficient evidence to conclude that the golf balls do not conform to the association s standards at the x 0 01 level of significance

Statistics
ProbabilityUse the same scales to construct modified boxplots for the pulse rates of men and women from the accompanying data sets Identify any outliers Use the boxplots to compare the two data sets Click the icon to view the data sets OC H8 40 50 60 70 80 90 100110 xx AENEAN Q G Q GEIXE OD 40 50 60 70 80 90 100110 10 50 60 70 69 65 1 Q G Q Q

Statistics
Probabilityopulation that is known to be normally distributed Answer parts a d C Draw a t distribution that depicts the critical region s Which of the following grap ritical region s in the t distribution A Q B Q O C

Statistics
ProbabilityIn a clinical trial 17 out of 827 patients taking a prescription drug daily complained symptoms Suppose that it is known that 1 7 of patients taking competing drugs flulike symptoms Is there sufficient evidence to conclude that more than 1 7 of t experience flulike symptoms as a side effect at the a 0 01 level of significance What are the null and alternative hypotheses Ho versus H Type integers or decimals Do not round
Statistics
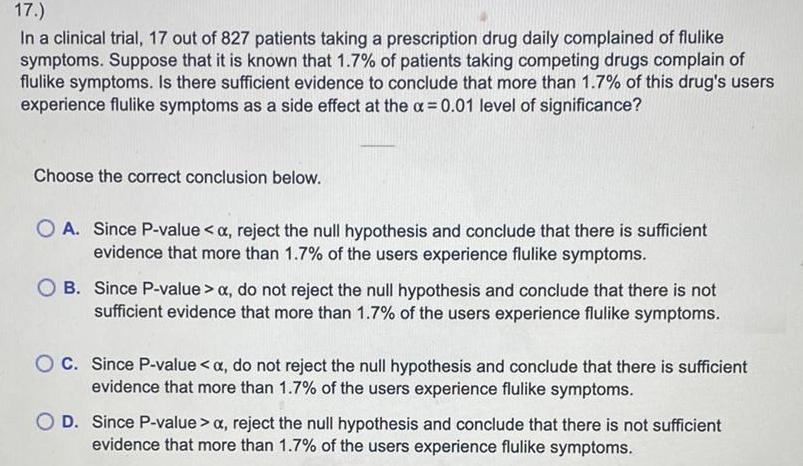
Probability17 In a clinical trial 17 out of 827 patients taking a prescription drug daily complained of flulike symptoms Suppose that it is known that 1 7 of patients taking competing drugs complain of flulike symptoms Is there sufficient evidence to conclude that more than 1 7 of this drug s users experience flulike symptoms as a side effect at the x 0 01 level of significance Choose the correct conclusion below O A Since P value x reject the null hypothesis and conclude that there is sufficient evidence that more than 1 7 of the users experience flulike symptoms OB Since P value x do not reject the null hypothesis and conclude that there is not sufficient evidence that more than 1 7 of the users experience flulike symptoms OC Since P value a do not reject the null hypothesis and conclude that there is sufficient evidence that more than 1 7 of the users experience flulike symptoms O D Since P value a reject the null hypothesis and conclude that there is not sufficient evidence that more than 1 7 of the users experience flulike symptoms