Statistics Questions
The best high school and college tutors are just a click away, 24×7! Pick a subject, ask a question, and get a detailed, handwritten solution personalized for you in minutes. We cover Math, Physics, Chemistry & Biology.

Statistics
ProbabilityScore 0 38 0 12 answered Question 11 Suppose an investment account is opened with an intial deposit of 11 000 earning 9 3 interest Round all answers to the nearest dollar a How much will the account be worth after 30 years if it is compounded monthly Submit b How much will the account be worth after 30 years if it is compounded continuously Question Help VIDEO Written Example Post to forum

Statistics
StatisticsA study was made of seat belt use among children who were involved in car crashes that caused Type numbers in the boxes aby Part 1 5 points aby Part 2 5 points them to be hospitalized It was found that children not wearing any restraints had hospital stays with a mean of 7 37 days and a standard deviation of 1 50 days with an approximately normal distribution 10 points a Find the probability that their hospital stay is from 5 to 6 days rounded to five decimal places b Find the probability that their hospital stay is greater than 6 days rounded to five decimal places

Statistics
StatisticsA certain medical test is known to detect 66 of the people who are afflicted with the disease Y Type numbers in the boxes If 10 people with the disease are administered the test what is the probability that the test will bPart 1 4 points ab Part 2 4 points show that ab Part 3 4 points 12 points All 10 have the disease rounded to four decimal places At least 8 have the disease rounded to four decimal places At most 4 have the disease rounded to four decimal places

Statistics
StatisticsAccording to one website approximately 78 of Americans celebrate Easter Suppose you ask 90 of your friends if they celebrate Easter Find the probability that more than 80 of your friends celebrate Easter Round to 3 decimal places

Statistics
StatisticsFind the temperature of a person in percentile 75 given that we expect the average temperature to be 98 6 with a standard deviation of 0 7 Round your answer to 2 decimal places percentile 75 96 5 97 2 97 9 98 6 99 3 100 100 7 101 temp Temperature

Statistics
StatisticsAn integrated sound component for video capture processes is developed using internal resources at a cost of 460 000 By the end of the year the company applies for and receives a patent on the sound component Note Enter debits before credits Transaction 3 General Journal Debit Credit

Statistics
ProbabilityMainline Produce Corporation acquired all the outstanding common stock of Iceberg Lettuce Corporation for 32 000 000 in cash The book values and fair values of Iceberg s assets and liabilities were as follows Current assets Property plant and equipment Other assets Current liabilities Long term liabilities Required Galculato Book Value 12 600 000 25 200 000 4 200 000 8 000 000 15 000 000 Fair Value 15 600 000 31 200 000 5 200 000 8 000 000 14 000 000

Statistics
Statisticsdent ading Time mprehension Edu 5 36 The ability to read rapidly and simultaneously maintain a high level of comprehension is often a determining factor in the academic success of many high school students A school district is considering a supplemental reading program for incoming freshmen Prior to implementing the program the school runs a pilot program on a random sample of n 20 students The students were thoroughly tested to determine reading speed and reading comprehension Based on a fixed length standardized test reading passage the following reading times in minutes and comprehension scores based on a 100 point scale were recorded 12 3 4 5 5 7 15 12 8 60 76 76 90 81 6 7 8 9 10 11 7 10 11 9 13 10 75 95 98 88 73 90 66 91 83 12 13 14 15 16 17 18 19 20 n 6 11 8 10 8 7 6 11 8 20 100 85 76 69 91 78 20 S y 9 10 82 05 10 88 2 573 a What is the population about which inferences are being made b Place a 95 confidence interval on the mean reading time for all incoming fresh men in the district c Plot the reading time using a normal probability plot or boxplot Do the data appear to be a random sample from a population having a normal distribution d Provide an interpretation of the interval estimate in part b

Statistics
Statistics5 21 A study was conducted of 90 adult male patients following a new treatment for congestive heart failure One of the variables measured on the patients was the increase in exercise capacity in minutes over a 4 week treatment period The previous treatment regime had produced an average increase of 2 minutes The researchers wanted to evaluate whether the new treatment had increased the value of in comparison to the previous treatment The data yielded y 2 17 and s 1 05 a Using a 05 what conclusions can you draw about the research hypothesis b What is the probability of making a Type II error if the actual value of is 2 1

Statistics
ProbabilityThe ages a Assuming that 2 of the ages are randomly selected with replacement list the different possible samples OA 55 46 55 60 46 55 46 60 60 55 60 46 B 55 55 55 46 55 60 46 55 46 46 46 60 60 55 60 46 60 60 c 55 46 55 60 46 60 OD 55 55 55 46 55 60 46 46 46 60 60 60 b Find the range of each of the samples then summarize the sampling distribution of the ranges in the format of a table representing the probability distribution Sample Range Probability 7

Statistics
StatisticsA graphing calculator is recommended The rabbit population on a small island is observed to be given by the function P t 120t0 5t 1200 where t is the time in months since observations of the island began PA 0 a When is the maximum population attained Round your answer to one decimal place months What is the maximum population Round your answer to the nearest whole number rabbits b When does the rabbit population disappear from the island Round your answer to one decimal place months

Statistics
ProbabilityThe ages years of three government officials when they died in office were 55 46 and 60 Complete parts a through d a Assuming that 2 of the ages are randomly selected with replacement list the different possible samples OA 55 46 55 60 46 55 46 60 60 55 60 46 OB 55 55 55 46 55 60 46 55 46 46 46 60 60 55 60 46 60 60 OC 55 46 55 60 46 60 OD 55 55 55 46 55 60 46 46 46 60 60 60

Statistics
StatisticsIse rates of women are normally distributed with a mean of 77 5 beats per minute and a standard deviation of 11 6 beats per minute Answer the following quest Ell Call x O hat are the values of the mean and standard deviation after converting all pulse rates of women to z scores using z P

Statistics
Statisticsssume that a randomly selected subject is given a bone density test Those test scores are normally distributed with a mean of 0 and a standard deviation of 1 Find probability that a given score is between 2 15 and 3 79 and draw a sketch of the region etch the region Choose the correct graph below A 2 15 3 79 OB 2 15 3 79 O C 2 15 3 79 O D 2 15 3 79

Statistics
StatisticsUse PMT P LIE 1 1 nt to determine the regular payment amount rounded to the nearest dollar The price of a small cabin is 30 000 The bank requires a 5 down payment The buyer is offered two mortgage options 20 year fixed at 7 5 or 30 year fixed at 7 5 Calculate the amount of interest paid for each option How much does the buyer save in interest with the 20 year option Find the monthly payment for the 20 year option Round to the nearest dollar as needed GUILLER

Statistics
StatisticsDetermine the shape of the distribution pictured below and the measure of center that should be used Frequency 20 15 10 5 0 5 1 5 2 5 3 5 4 5 5 5 6 5 7 5 data Q O Uniform O Bell shaped Skewed right O Skewed left Based on the shape of the histogram above what measure of center should be used O mean O median
Statistics
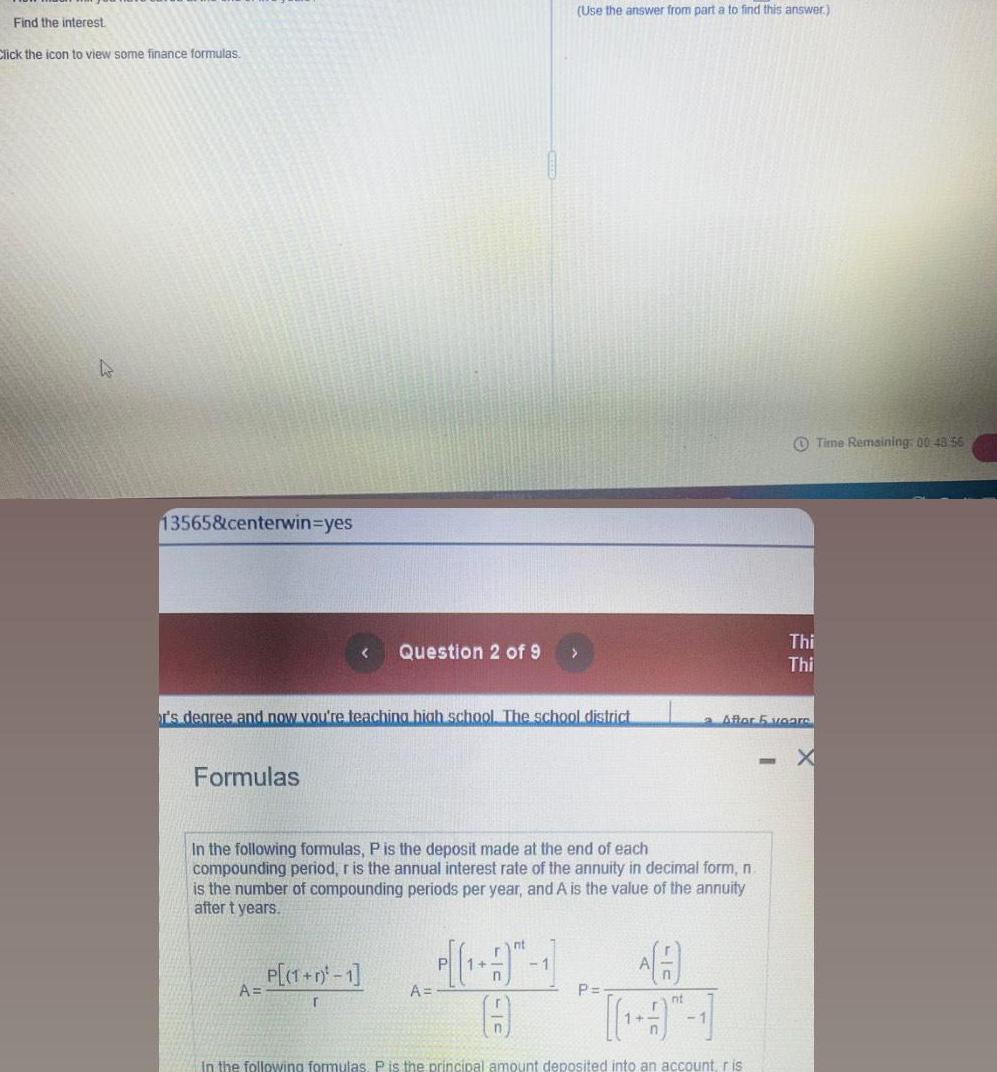
StatisticsFind the interest Click the icon to view some finance formulas 4 13565 centerwin yes Formulas or s degree and now you re teaching high school The school district Question 2 of 9 A P 1 r 1 In the following formulas P is the deposit made at the end of each compounding period r is the annual interest rate of the annuity in decimal form n is the number of compounding periods per year and A is the value of the annuity after t years A Use the answer from part a to find this answer 1 1 P 1 nt a After 6 voare in the following formulas P is the principal amount deposited into an account ris Time Remaining 00 48 56 Thi Thi X

Statistics
Statisticsa For the data shown above find the following Round the answer in the first blank to 2 decimal places Put the correct units in the second blank Find the mean Find the median Find the mode 65270 58456 52718 90090 52718 272500 98837 73877 b Remove the high CEO salary of 272500 dollars from the data Recompute the following Round the answer in the first blank to 2 decimal places Put the correct units in the second blank Find the mean Find the median

Statistics
ProbabilityCholesterol levels mg dL were collected from a random sample of patients two days after they had a heart attack A For the data shown above find the following Round the answer in the first box to 2 decimal places Put the correct units in the second box Find the mean Find the median Cholesterol level 280 206 142 276 234 160 224 226 310 220 318 270 210 294 272 244 288 236 282 288 Find the mode

Statistics
StatisticsLengths of a random sample of 15 rivers on the South Island of New Zealand that flow to the Pacific Ocean km or kilometers are listed in the table below Find the mean For the data shown above find the following Round the answer in the first box to 2 decimal places Put the correct units in the second box Find the median Length 209 169 322 288 64 48 90 145 64 95 64 161 Find the mode 80 138 209

Statistics
Probabilitythe age of 30 to save for retirement you decide to deposit 50 at the end of each month in an IRA at pays 3 5 compounded monthly b Use the following formula to determine how much you will have in the IRA when you retire at age 65 A A P 1 0 1 T A E nt Find the interest or his que poin s possible in the IRA when you retire a You will have approximately Do not round until the final answer Then round to the nearest dollar as needed b The interest is approximately Use the answer from part a to find this answer Round to the nearest dollar as needed

Statistics
ProbabilityOBFW Publishers How well do professional golfers putt from different distances Researchers collected data on the percent of putts made for various distances to the hole in feet Residual 02 0 0 02 0 4 3 0 33 40 Predicted In percent made Starnes Tabor The Practice of Statistics 6e 0 2018 Bedford Freeman Worth High School Publishers 25 In percent made Model In percent made vs Distance Predictor Coef Constant Distance S 0 160 4 6649 percent made 0 1091 R sq 0 939 SE Coef 0 0825 0 0067 Calculate and interpret the residual for the point where the golfers made 31 of putts from 14 feet away Enter all calculations below accurate to at least 2 decimal places T 56 511 16 24 R Sq adj 0 936 P 0 0000 0 0000

Statistics
ProbabilityAn industrial engineer conjectures that a major difference between successful and unsuccessful companies is the percentage of their manufactured products returned because of defectives In a study to evaluate this conjecture the engineer surveyed the quality control departments of 50 successful companies identified by the annual profit statement and 50 unsuccessful companies The companies in the study all produced products of a similar nature and cost The percentages of the total output returned by customers in the previous year are provided in following table Unsuccessful 11 35 Businesses 8 34 6 56 8 93 8 26 Successful Businesses 10 24 5 43 5 09 3 62 4 06 9 19 7 69 6 85 7 32 7 07 6 16 6 32 8 20 2 23 7 70 10 30 13 58 8 06 13 70 12 23 5 06 0 43 10 51 1 08 8 32 8 59 10 49 7 71 8 67 11 93 10 64 7 30 1 94 9 16 6 33 4 98 11 07 11 04 10 08 4 76 Unsuccessful Successful 6 77 0 47 9 82 6 07 3 83 6 82 6 98 11 69 8 53 13 81 10 13 10 82 6 69 7 51 4 96 6 03 9 77 9 40 9 14 11 41 4 59 9 34 0 91 4 46 9 05 The sample means and standard deviations are N Mean 50 8 97 50 5 72 11 15 9 36 10 00 9 02 6 44 1 38 2 39 6 17 2 13 6 41 9 38 8 39 5 45 6 70 9 50 8 81 11 06 0 17 2 41 0 27 8 32 7 98 9 67 5 66 8 99 1 97 4 19 7 47 7 24 8 48 St Dev 2 20 3 24 Let u mean percentage of their manufactured products returned because of defectives from unsuccessful

Statistics
StatisticsA study was conducted of 90 adult male patients following a new treatment for congestive heart failure One of the variables measured on the patients was the increase in exercise capacity in minutes over a 4 week treatment period The previous treatment regime had produced an average increase of u 2 minutes The researchers wanted to evaluate whether the new treatment had increased the value of m in comparison to the previous treatment The data yielded y 2 17 and s 1 05 What is the probability of making a Type Il error if the actual value of u is 2 1 Use 4 decimal places

Statistics
StatisticsUse your calculator to approximate the value of each square root to 2 decimal places a 60 b 241


Statistics
ProbabilityWhat is the largest perfect square factor of 8 Simplify 8 completely to the form av


Statistics
StatisticsThe susceptibility of the root stocks of a variety of orange tree to a specific larva is investigated by a group of researchers Forty orange trees are exposed to the larva and then examined by the researchers 6 months after exposure The number of larvae per gram is recorded on each root stock The mean and standard deviation of the logarithm of the counts are recorded to be 9 02 and 1 12 respectively We want to construct a 90 confidence interval on the mean of the logarithm of the larvae counts A 90 confidence interval is 8 73 The lower limit is given and find the upper limit Use 2 decimal places

Statistics
ProbabilityEvaluate each expression using order of operations A 3 B 3 Do you notice a pattern in your answers


Statistics
StatisticsEvaluate each expression or state the the expression is not a real number DNE Part 1 9 Part 2 9 Part 3 9


Statistics
Probability11 Men s Heights The distribution of heights of adult American men is approximately Normal with mean 69 inches and standard deviation 2 5 inches Use the Empirical Rule to answer the following questions a What percent of men are taller than 74 inches b Between what heights do the middle 95 of men fall c What percent of men are between 64 and 66 5 inches tall d A height of 71 5 inches corresponds to what percentile of adult male American heights

Statistics
ProbabilityMultiple Choice Fill in the correct answer to each of the following questions on the scantron form 2 pts each 1 In the NUSAP system for quantitative data presentation the S stands for A Statistics B Standard Deviation C Spread D Significant Figures 2 In NUSAP this factor encompasses everything done to stand behind the data s reliability Qa Qc traceability of weights etc A N B U C S D A E P 3 In statistics the null hypothesis Ho usually is stated as Wha A There is a significant difference between 2 values unless proven otherwise B There is no way of knowing for certain if 2 values are different C There is no statistically significant difference between 2 values D The difference between 2 values decreases as their uncertainties increase 4 Which test can be used to determine if there is an outlier in a set of data A Dixon B Q C Grubbs D All of the above 5 When would a one tailed table be used to determine if an outlier can be statistically excluded 12 A If the data does not follow a gaussian distribution rawalbe B If the outlier always falls to one side of the curve C If the data point doesn t look right D Never 6 A laboratory must be and an individual analyst should be do demonstrate their qualifications A certified also certified B accredited also accredited C certified accredited

Statistics
StatisticsThe following graph shows a GPA Grade point average 4 0 3 0 2 0 1 0 0 3 Onegative O positive Olack of 6 9 12 Drinks per week relationship between the variables W

Statistics
Probability4 2 pts A group of students recorded the colors of all of the cars in a parking lot Their results are show to the right a How many cars were there b What is the relative frequency of the green cars 12 10 8 6 4 2 0 white silver Number of cars dt red blue black green gray

Statistics
Statistics1 2 pts Make a stem and leaf plot for the following exam scores 94 57 77 82 90 85 73 91 89 94 63 41 100 98 88

Statistics
Probability2 2 pts The distribution to the right shows the heights of black cherry trees a What is the class bucket width of this distribution b How many black cherry trees are between 75 and 85 feet tall 8 Frequency 4 2 0 Heights of Black Cherry Trees 60 65 75 80 85 90 70 Height feet


Statistics
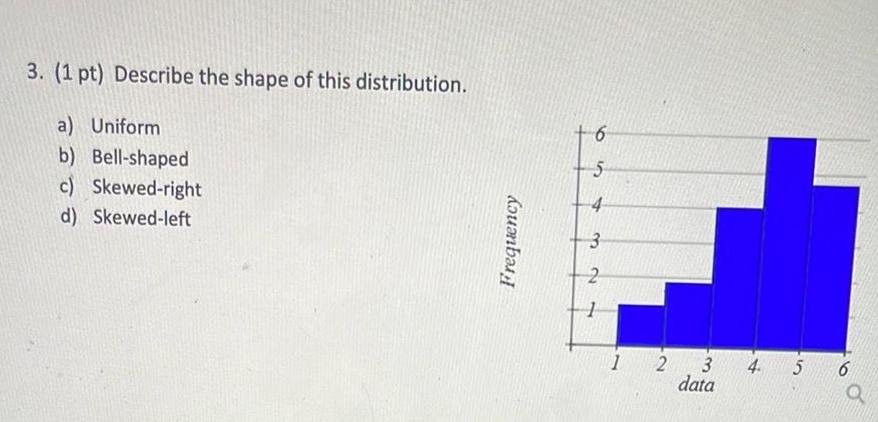
Statistics3 1 pt Describe the shape of this distribution a Uniform b Bell shaped c Skewed right d Skewed left Frequency 6 5 3 2 2 3 data 4 5 6

Statistics
Probability3 10 2023 Level 1 5 cm B 10 2023 Level 2 7 5 cm B 10 2023 Level 3 12 cm 3 10 2023 Level 4 15 cm 3 16 2023 Level 1 5 cm 3 16 2023 Level 2 7 5 cm 3 16 2023 Level 3 12 cm B 16 2023 Level 4 15 cm B3 20 2023 Level 1 5 cm 3 20 2023 Level 2 7 5 cm 8 20 2023 Level 3 12 cm 17 22 18 15 11 15 20 16 5 11

Statistics
ProbabilityThe pie chart to the right shows how adults rate their financial shape Suppose 4 people are chosen at random from a group of 1300 What is the probability that all four would rate their financial shape as excellent Make the assumption that the 1300 people are represented by the pie chart The probability is Round to six decimal places as needed Excellent 7 Good 44 Fair 35 Poor 13 Other 1 www

Statistics
Statistics7 pts There are 12 M M s in a bag 3 of them are blue 5 are red and 4 of them are green We are going to draw 2 of them from the bag one at a time without replacing them Hint it might help to draw a probability tree to help you with this question Calculate the following probabilities showing your work and giving your solutions as percentages with 2 decimal places Drawing a red M M and then a green M M

Statistics
Statistics13 pts After a survey where students had to pick their favorite preferred genre of movie and their favorite preferred genre of music We put their results in the table below If we select one student from our survey at random find the probability that they Note give your solutions both as unreduced fractions and decimals rounded to 4 decimal places Rap Rock Country Total 35 25 90 9 44 3 16 37 150 Comedy 30 Drama 16 19 Horror 9 TOTAL 63 Prefer Comedy Prefer Rap ANTT n

Statistics
ProbabilityA 23 22 A A A 19 4 IN 3238 34 2A 23 INN A2 23 WIM 163 DA 4 4 A 44 49954 a fa 5 55 S 71 516 10 18 1995 6 pts For the following questions we are considering a standard deck of cards I have included an image for your reference What is the probability that we will draw a face card