Probability Questions and Answers

Statistics
Probability2 1 pt Suppose you compute a 95 confidence interval What will happen to the confidence interval if you increase the confidence level to 99

Statistics
Probability1 1 pt Suppose you compute a confidence interval with a sample size of 40 What will happen to the confidence interval if the sample size increases to 75


Statistics
ProbabilityTwo samples are taken with the following numbers of successes and sample sizes 71 33 72 38 n 90 n 64 Find a 97 confidence interval round answers to the nearest thousandth P1 P2
Statistics
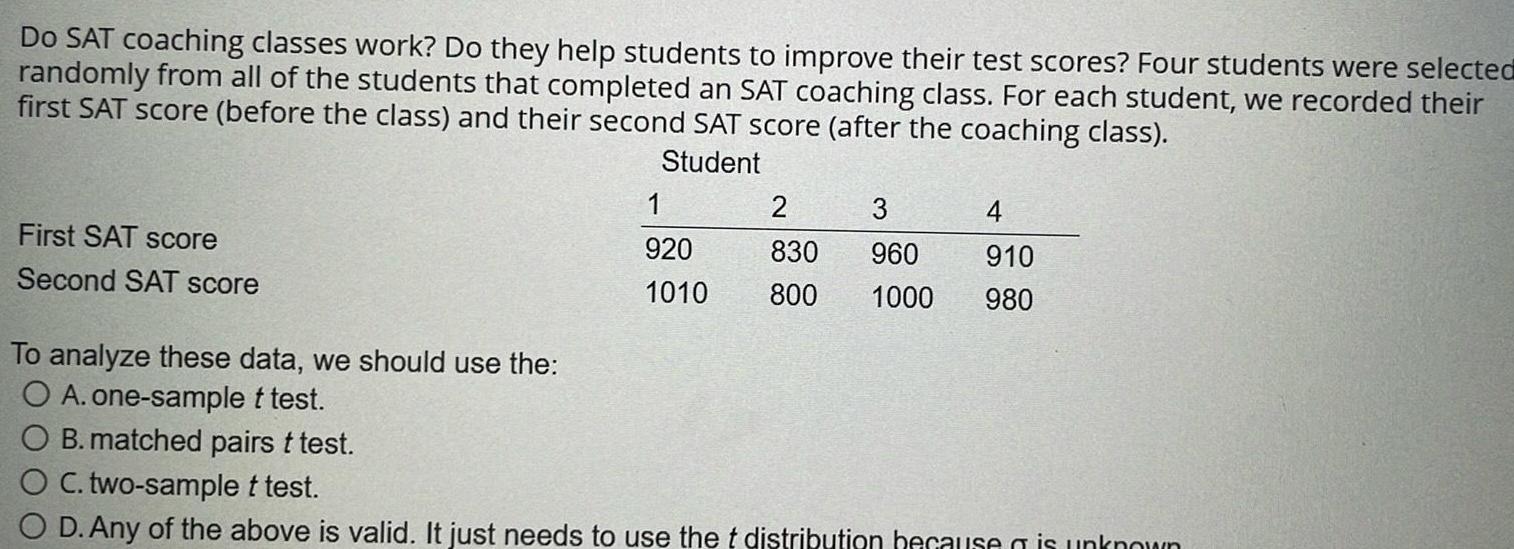
ProbabilityDo SAT coaching classes work Do they help students to improve their test scores Four students were selected randomly from all of the students that completed an SAT coaching class For each student we recorded their first SAT score before the class and their second SAT score after the coaching class Student First SAT score Second SAT score 1 920 1010 2 3 4 830 960 910 800 1000 980 To analyze these data we should use the O A one sample t test O B matched pairs t test O C two sample t test O D Any of the above is valid It just needs to use the t distribution because is unknown
Statistics
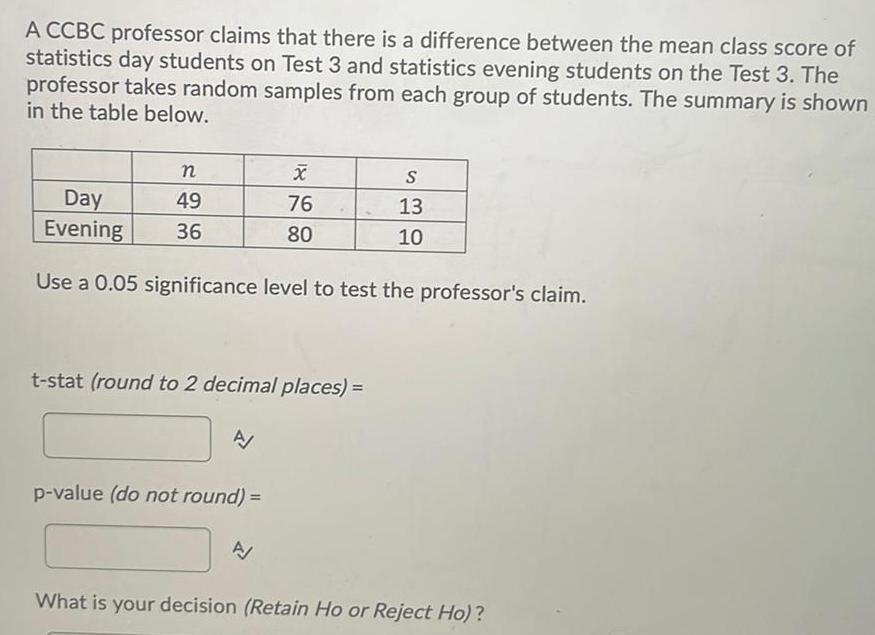
ProbabilityA CCBC professor claims that there is a difference between the mean class score of statistics day students on Test 3 and statistics evening students on the Test 3 The professor takes random samples from each group of students The summary is shown in the table below n 49 36 Day Evening Use a 0 05 significance level to test the professor s claim t stat round to 2 decimal places A X 76 80 p value do not round A S 13 10 What is your decision Retain Ho or Reject Ho
Statistics
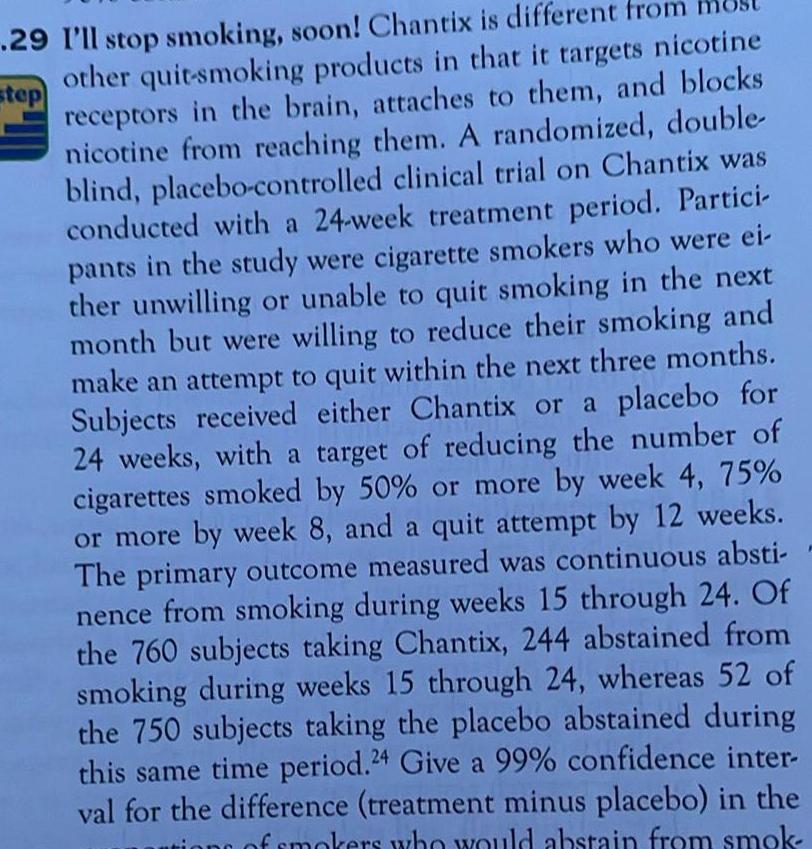
Probabilitystep 29 I ll stop smoking soon Chantix is different from other quit smoking products in that it targets nicotine receptors in the brain attaches to them and blocks nicotine from reaching them A randomized double blind placebo controlled clinical trial on Chantix was conducted with a 24 week treatment period Partici pants in the study were cigarette smokers who were ei ther unwilling or unable to quit smoking in the next month but were willing to reduce their smoking and make an attempt to quit within the next three months Subjects received either Chantix or a placebo for 24 weeks with a target of reducing the number of cigarettes smoked by 50 or more by week 4 75 or more by week 8 and a quit attempt by 12 weeks The primary outcome measured was continuous absti nence from smoking during weeks 15 through 24 Of the 760 subjects taking Chantix 244 abstained from smoking during weeks 15 through 24 whereas 52 of the 750 subjects taking the placebo abstained during this same time period 24 Give a 99 confidence inter val for the difference treatment minus placebo in the of smokers who would abstain from smok
Statistics
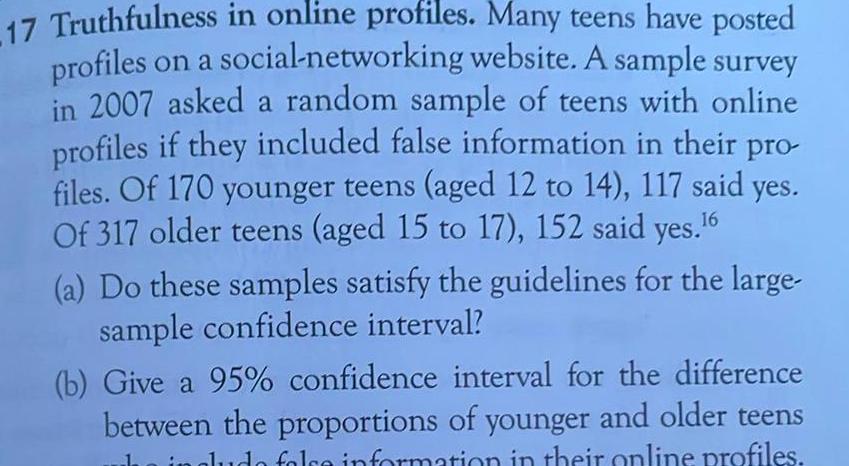
Probability17 Truthfulness in online profiles Many teens have posted profiles on a social networking website A sample survey in 2007 asked a random sample of teens with online profiles if they included false information in their pro files Of 170 younger teens aged 12 to 14 117 said yes Of 317 older teens aged 15 to 17 152 said yes 6 a Do these samples satisfy the guidelines for the large sample confidence interval b Give a 95 confidence interval for the difference between the proportions of younger and older teens in in gludo folce information in their online profiles
Statistics
ProbabilityWhich of the following is NOT a requirement in determining whether there is a linear correlation between two variables Choose the correct answer below OA Any outliers must be removed if they are known to be errors OB The sample of paired data is a simple random sample of quantitative data OC A scatterplot should visually show a straight line pattern D If r 1 then there is a positive linear correlation
Statistics
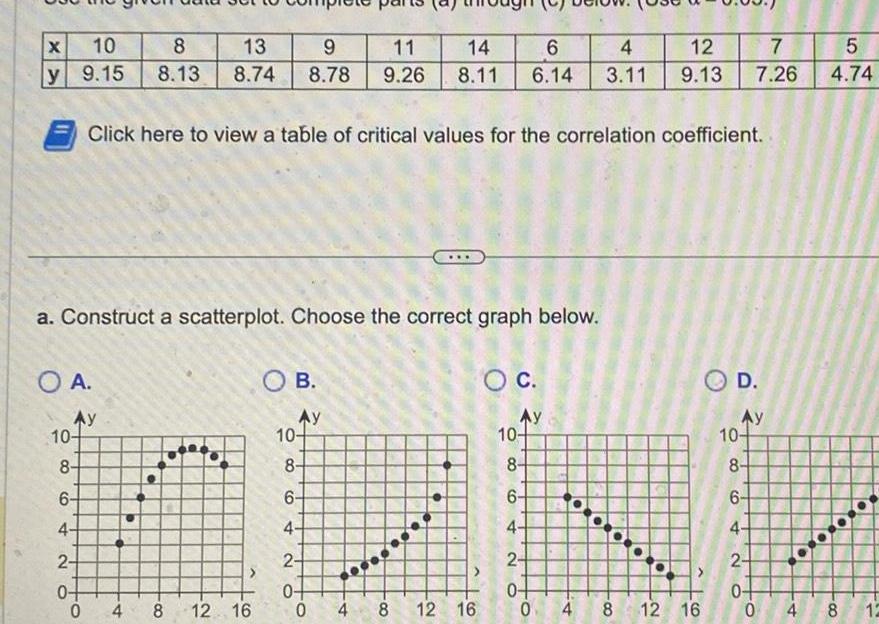
ProbabilityX 10 8 13 9 y 9 15 8 13 8 74 8 78 a Construct a scatterplot Choose the correct graph below O A Click here to view a table of critical values for the correlation coefficient Ay 10 8 6 4 2 0 0 4 8 12 16 OB Ay 10 8 11 14 6 4 12 7 9 26 8 11 6 14 3 11 9 13 7 26 6 4 2 0 0 4 8 12 16 O C Ay 10 8 6 4 OD 2 0 0 4 8 12 16 Ay 5 4 74 10 8 6 4 2 0 0 4 8 12 0 000
Statistics
ProbabilityIf we find that there is a linear correlation between the concentration of carbon dioxide in our atmosphere and the global temperature does that indicate that changes in the concentration of carbon dioxide cause changes in the global temperature Choose the correct answer below O A Yes The presence of a linear correlation between two variables implies that one of the variables is the cause of the other variable OB No The presence of a linear correlation between two variables does not imply that one of the variables is the cause of the other variable
Statistics
ProbabilityTwenty different statistics students are randomly selected For each of them their body temperature C is measured and their head circumference cm is measured If it is found that r 0 does that indicate that there is no association betwen these two variables Choose the correct answer below O A No because r does not measure the strength of the relationship only its direction OB Yes because if r 0 the variables are completely unrelated OC No because if r 0 the variables are in a perfect linear relationship OD No because while there is no linear correlation there may be a relationship that is not linear
Statistics
ProbabilityYou may need to use the appropriate appendix table or technology to answer this question The average number of calls received by a switchboard in a 30 minute period is 19 Round your answers to four decimal places a What is the probability that between 10 00 and 10 30 the switchboard will receive exactly 16 calls b What is the probability that between 10 00 and 10 30 the switchboard will receive more than 13 calls but fewer than 21 calls c What is the probability that between 10 00 and 10 30 the switchboard will receive fewer than 10 calls
Statistics
ProbabilityYou may need to use the appropriate appendix table or technology to answer this question General Hospital has noted that they admit an average of 6 patients per hour a What is the probability that during the next hour fewer than 2 patients will be admitted Round your answers to four decimal places b What is the probability that during the next two hours exactly 6 patients will be admitted Round your answers to four decimal places
Statistics
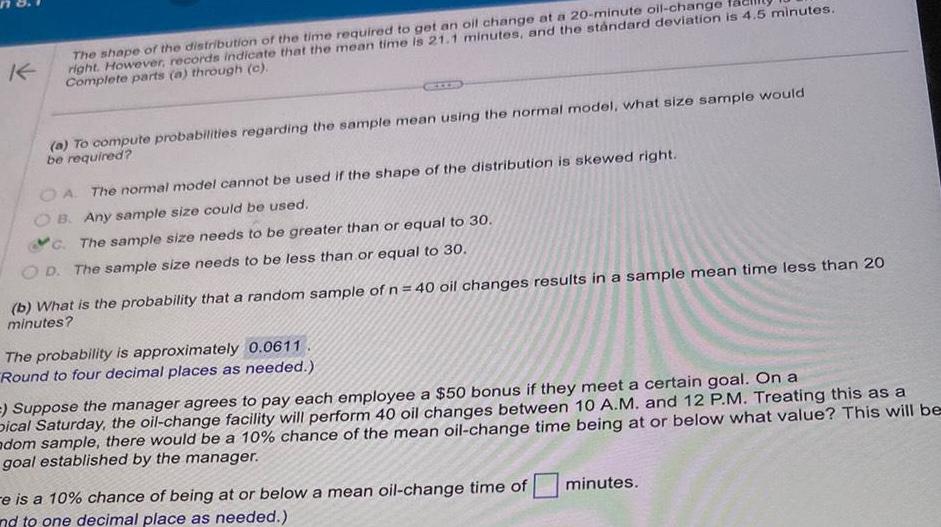
ProbabilityK The shape of the distribution of the time required to get an oil change at a 20 minute oil change right However records indicate that the mean time is 21 1 minutes and the standard deviation is 4 5 minutes Complete parts a through c a To compute probabilities regarding the sample mean using the normal model what size sample would be required OA The normal model cannot be used if the shape of the distribution is skewed right B Any sample size could be used C The sample size needs to be greater than or equal to 30 OD The sample size needs to be less than or equal to 30 b What is the probability that a random sample of n 40 oil changes results in a sample mean time less than 20 minutes The probability is approximately 0 0611 Round to four decimal places as needed Suppose the manager agrees to pay each employee a 50 bonus if they meet a certain goal On a Dical Saturday the oil change facility will perform 40 oil changes between 10 A M and 12 P M Treating this as a adom sample there would be a 10 chance of the mean oil change time being at or below what value This will be goal established by the manager e is a 10 chance of being at or below a mean oil change time of nd to one decimal place as needed minutes
Statistics
ProbabilityConsider a Poisson distribution with a mean of two occurrences per time period a Write the appropriate Poisson probability function f x b What is the expected number of occurrences in three time periods c Write the appropriate Poisson probability function to determine the probability of x occurrences in three time periods f x d Compute the probability of two occurrences in one time period Round your answer to four decimal places e Compute the probability of six occurrences in three time periods Round your answer to four decimal places f Compute the probability of four occurrences in two time periods Round your answer to four decimal places
Statistics
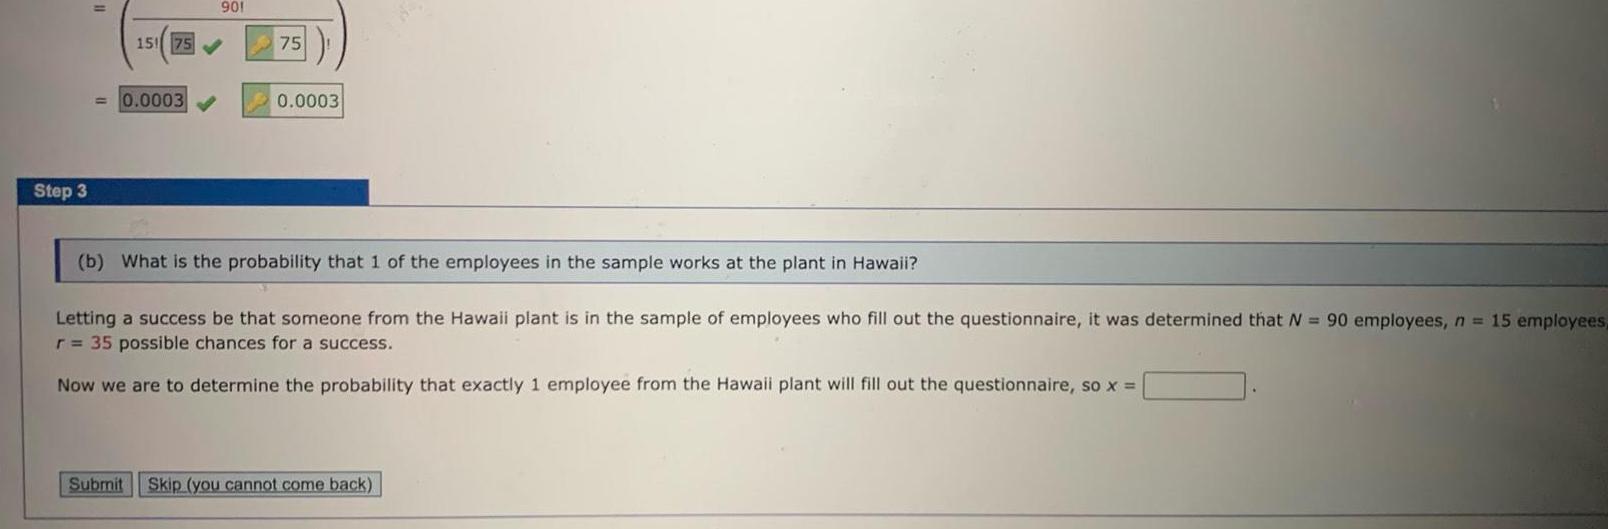
ProbabilityStep 3 901 15 75 0 0003 75 0 0003 b What is the probability that 1 of the employees in the sample works at the plant in Hawaii Letting a success be that someone from the Hawaii plant is in the sample of employees who fill out the questionnaire it was determined that N 90 employees n 15 employees r 35 possible chances for a success Now we are to determine the probability that exactly 1 employee from the Hawaii plant will fill out the questionnaire so x Submit Skip you cannot come back
Statistics
ProbabilityYou may need to use the appropriate appendix table or technology to answer this question Airline passengers arrive randomly and independently at the passenger screening facility at a major international airport The mean arrival rate is 10 passengers per minute Round your answer six decimal places a Compute the probability of no arrivals in a one minute period b Compute the probability that three or fewer passengers arrive in a one minute period c Compute the probability of no arrivals in a 21 second period d Compute the probability of at least one arrival in a 21 second period
Statistics
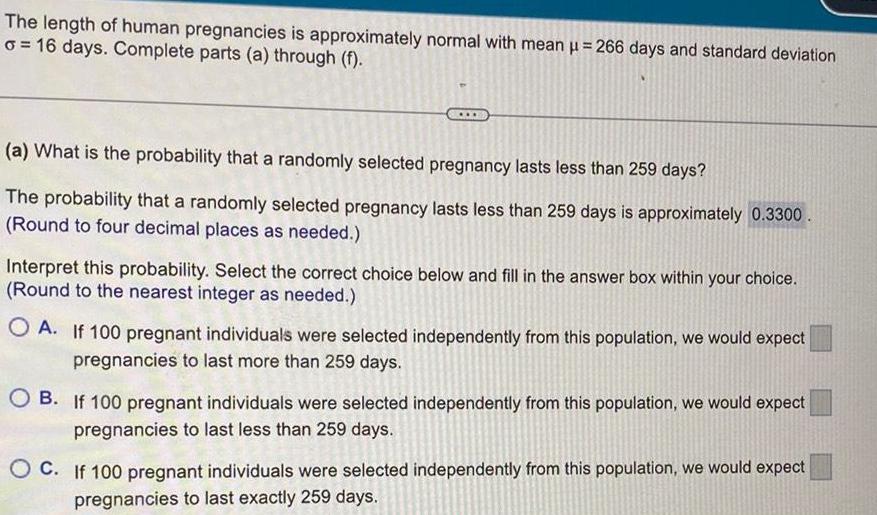
ProbabilityThe length of human pregnancies is approximately normal with mean 266 days and standard deviation o 16 days Complete parts a through f a What is the probability that a randomly selected pregnancy lasts less than 259 days The probability that a randomly selected pregnancy lasts less than 259 days is approximately 0 3300 Round to four decimal places as needed Interpret this probability Select the correct choice below and fill in the answer box within your choice Round to the nearest integer as needed OA If 100 pregnant individuals were selected independently from this population we would expect pregnancies to last more than 259 days OB If 100 pregnant individuals were selected independently from this population we would expect pregnancies to last less than 259 days OC If 100 pregnant individuals were selected independently from this population we would expect pregnancies to last exactly 259 days
Statistics
ProbabilityThe Zagat Restaurant Survey provides food decor and service ratings for some of the top restaurants across the United States For 21 restaurants located in a certain city the average price of a dinner including one drink and tip was 48 60 You are leaving on a business trip to this city and will eat dinner at three of these restaurants Your company will reimburse you for a maximum of per dinner Business associates familiar with these restaurants have told you that the meal cost at one third of these restaurants will exceed 50 Suppose that you randomly select three of these restaurants for dinner Round your answers to four decimal places a What is the probability that none of the meals will exceed the cost covered by your company b What is the probability that one of the meals will exceed the cost covered by your company c What is the probability that two of the meals will exceed the cost covered by your company d What is the probability that all three of the meals will exceed the cost covered by your company
Statistics
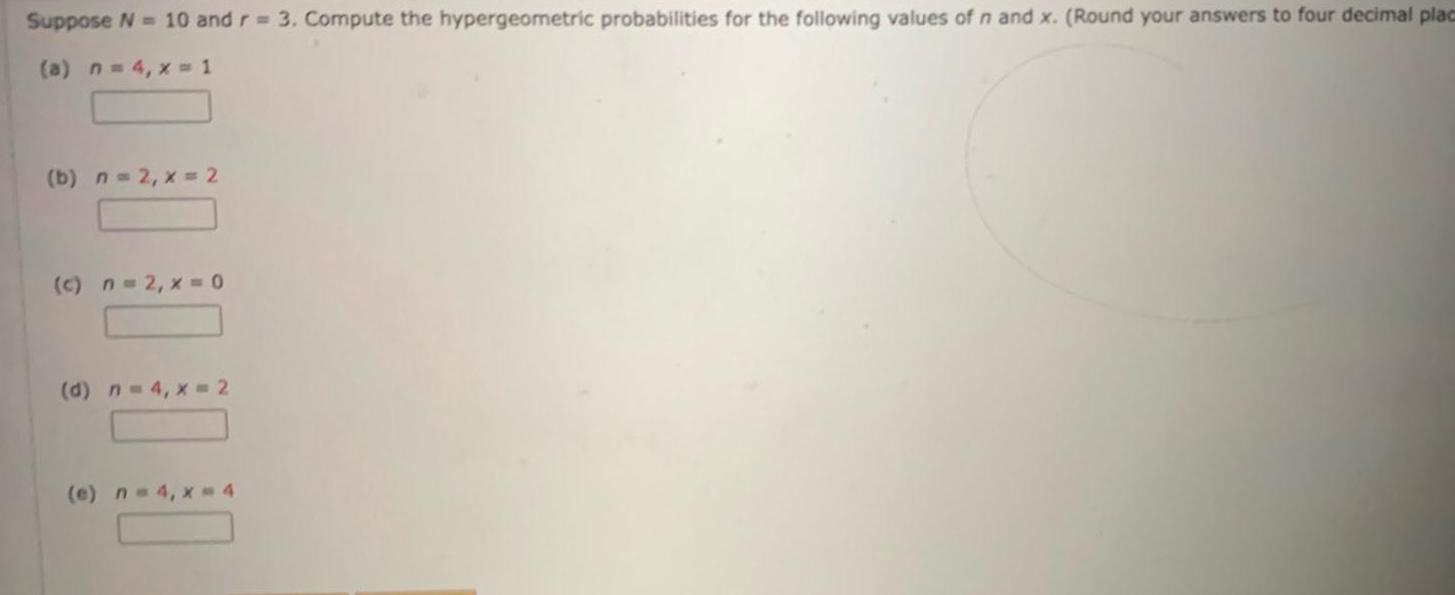
ProbabilitySuppose N 10 and r 3 Compute the hypergeometric probabilities for the following values of n and x Round your answers to four decimal plac a n 4 x 1 b n 2 x 2 c n 2 x 0 d n 4 x 2 e n 4 x 4
Statistics
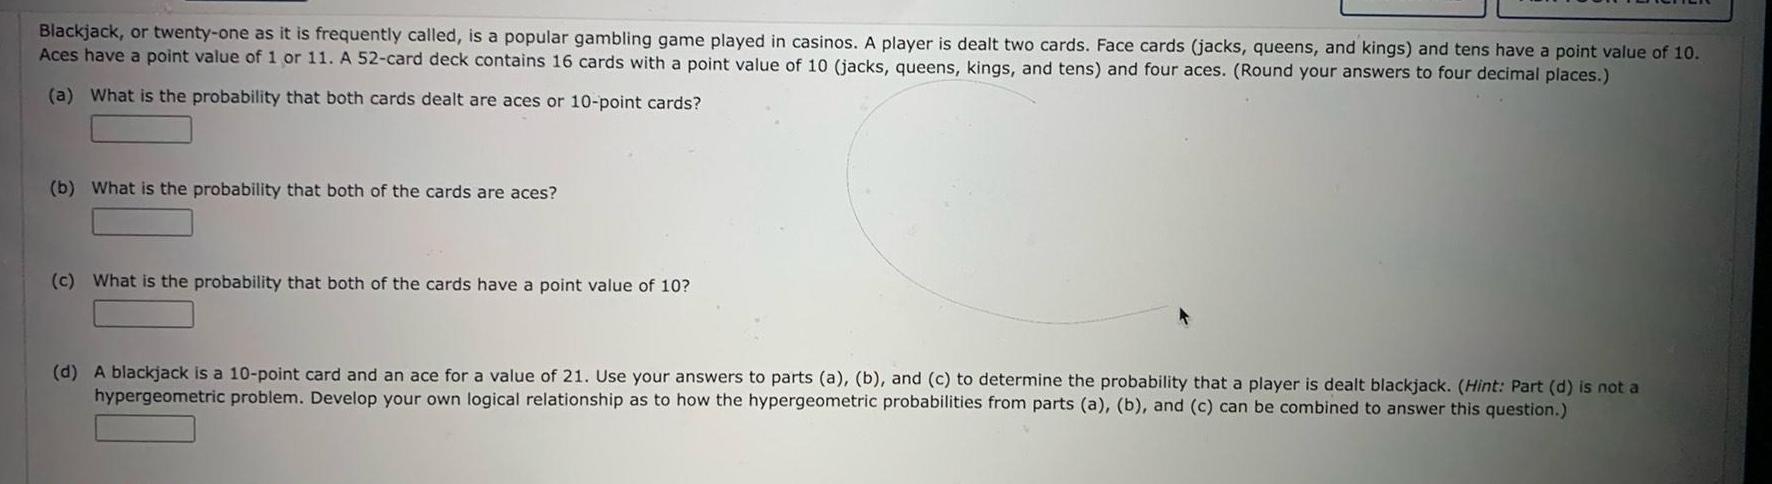
ProbabilityBlackjack or twenty one as it is frequently called is a popular gambling game played in casinos A player is dealt two cards Face cards jacks queens and kings and tens have a point value of 10 Aces have a point value of 1 or 11 A 52 card deck contains 16 cards with a point value of 10 jacks queens kings and tens and four aces Round your answers to four decimal places a What is the probability that both cards dealt are aces or 10 point cards b What is the probability that both of the cards are aces c What is the probability that both of the cards have a point value of 10 d A blackjack is a 10 point card and an ace for a value of 21 Use your answers to parts a b and c to determine the probability that a player is dealt blackjack Hint Part d is not a hypergeometric problem Develop your own logical relationship as to how the hypergeometric probabilities from parts a b and c can be combined to answer this question
Statistics
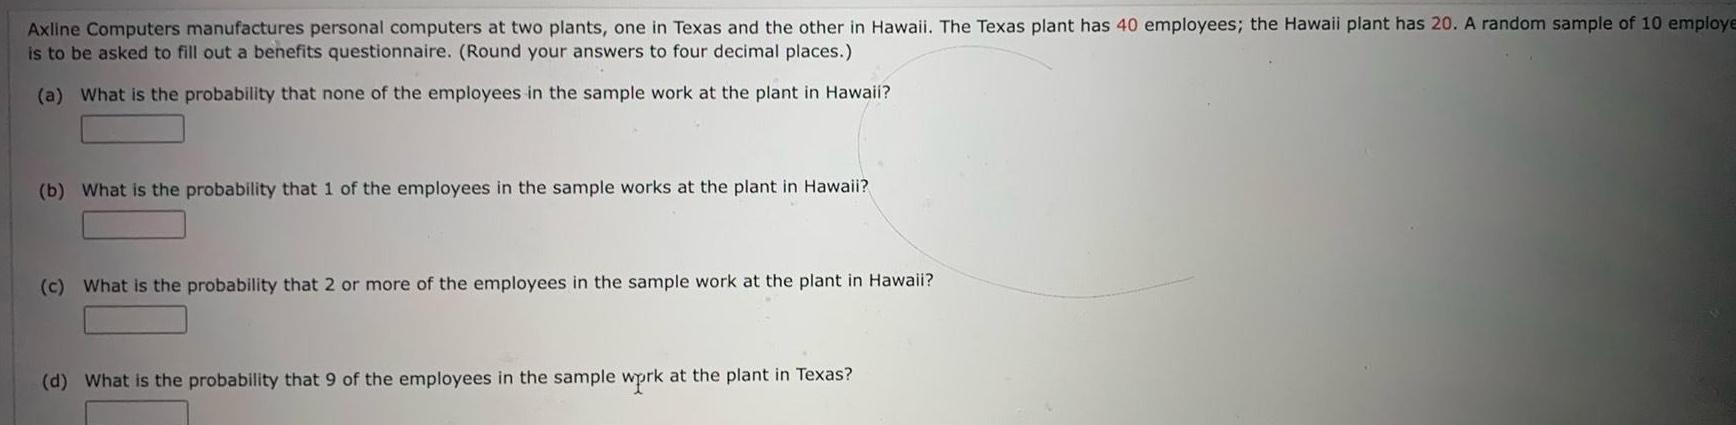
ProbabilityAxline Computers manufactures personal computers at two plants one in Texas and the other in Hawaii The Texas plant has 40 employees the Hawaii plant has 20 A random sample of 10 employe is to be asked to fill out a benefits questionnaire Round your answers to four decimal places a What is the probability that none of the employees in the sample work at the plant in Hawaii b What is the probability that 1 of the employees in the sample works at the plant in Hawaii c What is the probability that 2 or more of the employees in the sample work at the plant in Hawaii d What is the probability that 9 of the employees in the sample wprk at the plant in Texas

Statistics
ProbabilityQuestion 8 of 8 8 Correctly classify the quantitative variable number of seeds in a watermelon Discrete Continuous Continue Reset answer

Statistics
ProbabilityUsing the the drop down menus below please place the steps of a hypothesis test in the correct order The steps of a hypothesis test are 1 Select 2 Select 3 Select 4 Select 5 Select

Statistics
Probabilitythe game of roulette a wheel consists of 38 slots numbered 0 00 1 2 36 To play the game a metal ball is spun around the wheel and is allowed to fall into one of the numbered slots If the number of the slot the ball falls ins matches the number you selected you win 35 otherwise you lose 1 Complete parts a through g below Click here to view the standard normal distribution table page 1 Click here to view the standard normal distribution table page 2 a Construct a probability distribution for the random variable X the winnings of each spin P x X 35 1 Type integers or decimals rounded to four decimal pla Save

Statistics
Probabilityshape of the distribution of the time required to get an oil change at a 20 minute oil change facility is skewec right However records indicate that the mean time is 21 1 minutes and the standard deviation is 4 5 minutes Complete parts a through c a To compute probabilities regarding the sample mean using the normal model what size sample would be required OA The normal model cannot be used if the shape of the distribution is skewed right OB Any sample size could be used OC The sample size needs to be greater than or equal to 30 OD The sample size needs to be less than or equal to 30 Save

Statistics
ProbabilitySuppose the lengths of human pregnancies are normally distributed with 266 days and a 16 days Complete parts a and b below a The figure to the right represents the normal curve with 266 days and o 16 days The area to the left of X 240 is 0 0521 Provide two interpretations of this area Provide one interpretation of the area using the given values Select the correct choice below and fill in the answer boxes to complete your choice Type integers or decimals OA The proportion of human pregnancies that last more than OB The proportion of human pregnancies that last less than days is days is b The figure to the right represents the normal curve with 266 days and o 16 days The area between x 280 and x 300 is 0 1740 Provide two interpretations of this area OA The proportion of human pregnancies that last less than days is OB The proportion of human pregnancies that last between Provide one interpretation of the area using the given values Select the correct choice below and fill in the answer boxes to complete your choice Type integers or decimals Use ascending order Provide a second interpretation of the area using the given values Select the correct choice below and fill in the answer boxes to complete your choice Type integers or decimals OA The probability that a randomly selected human pregnancy lasts more than OB The probability that a randomly selected human pregnancy lasts less than or more than A 240 266 and days is days is days is X 266 280 300 or more than Q and days is X Provide a second interpretation of the area using the given values Select the correct choice below and fill in the answer boxes to complete your choice Type integers or decimals Use ascending order OA The probability that a randomly selected human pregnancy lasts less than OB The probability that a randomly selected human pregnancy lasts between G days is

Statistics
Probabilityis a problem calculating probability Consider some physical system which is equally likely to be in one of any of 1000 unique microstates Let s say the system is in a macrostate with physical property A fa hese microstates Let s say the system is in a macrostate with physical property B for 5 of these microstates What is the relative probability i e how many times more or less likely that the system has sical property A

Statistics
ProbabilityFind the y intercept of the line y 4 x 15 Write your answer as an integer or as a simplified proper or improper fraction not as an ordered pair

Statistics
ProbabilityUse the following scenario for questions 3 and 4 The next two questions concern this situation A random sample survey interviewed 3 800 U S adults nationwide by telephone One question asked was whether they agreed with this statement Some people say we should have a third major political party in this country in addition to the Democrats and Republicans In this sample 53 of the people asked responded Yes we should have a third political party The population for this sample survey appears to be The news article that reports the poll results says T percentage points This means that I Select Select Select the 3 800 people who were interviewed all registered voters

Statistics
ProbabilityA business has six customer service telephone lines Consider the random variable x Number of lines in use at a randomly selected time Suppose that the probability distribution of x is as follows X p x 0 Need Help Submit Answer 1 2 Read It 3 a Calculate the mean value and standard deviation of x Round your standard deviation to four decimal places Hx ox 4 0 05 0 10 0 17 0 41 0 17 0 08 0 02 b What is the probability that the number of lines in use is farther than 3 standard deviations from the mean value Watch It 5 6 Master It PECKSTAT3 6 4 038 MY NOTES PRACTICE ANOTHER 5 4 Points DETAILS The probability distribution of x the number of tires needing replacement on a randomly selected automobile checked at a certain inspection station is given in the following table

Statistics
ProbabilityA machine producing vitamin E capsules operates so that the actual amount of vitamin E in each capsule is normally distributed with a mean of 6 mg and a standard deviation of 0 05 mg Round answers to four decimal places USE SALT What is the probability that a randomly selected capsule contains less than 5 9 mg of vitamin E MY NOT What is the probability that a randomly selected capsule contains at least 6 2 mg of vitamin E

Statistics
ProbabilityPurchases made at small corner stores were studied by the authors of a certain paper Corner stores were defined as stores that are less than 200 square feet in size have only one cash register and primarily sell food After observing a large number of corner store purchases in Philadelphia the authors reported that the average number of grams of fat in a corner store purchase was 21 9 Suppose that the variable x Number of grams of fat in a corner store purchase has a distribution that is approximately normal with a mean of 21 9 grams and a standard deviation of 7 grams Round your answers to four decimal places LUSE SALT a What is the probability that a randomly selected corner store purchase has more than 29 grams of fat b What is the probability that a randomly selected corner store purchase has between 15 and 25 grams of fat c If two corner store purchases are randomly selected what is the probability that both of these purchases will have more than 25 grams of fat Submit Answer 8 2 Points DETAILS PECKSTAT3 6 5 061 S MY NOTES

Statistics
ProbabilityA pizza shop sells pizzas in four different sizes The 1 000 most recent orders for a single pizza resulted in the following proportions for the various sizes Size inches 12 Proportion 14 16 Submit Answer 0 10 0 35 0 48 0 07 With x Size of a pizza in a single pizza order the given table is an approximation to the probability distribution of x a Write a few sentences describing what you would expect to see for pizza sizes over a long sequence of single pizza orders Give your answers as percents for 14 inch pizza In the long run we would expect to see approximately of the single pizza orders for 12 inch pizza for 18 inch pizza b What is the approximate value of P x 16 18 c What is the approximate value of P x 16 MY N for 16 inch piz

Statistics
ProbabilitySuppose that the distribution of typing speed in words per minute wpm for experienced typists using a new type of split keyboard can be approximated by a normal curve with mean 60 wpm and standard deviation 15 wpm t Round your answers to four decimal places LUSE SALT a What is the probability that a randomly selected typist s speed is at most 60 wpm What is the probability that a randomly selected typist s speed is less than 60 wpm b What is the probability that a randomly selected typist s speed is between 30 and 75 wpm c Would you be surprised to find a typist in this population whose speed exceeded 105 wpm It Select be surprising to find a typist in this population whose speed exceeded 105 wpm because the probability of finding such a typist is only d Suppose that two typists are independently selected What is the probability that both their speeds exceed 90 wpm e Suppose that special training is to be made available to the slowest 15 of the typists What typing speeds in wpm would qualify individuals for this training wpm or less is in the slowest 15 of typists Any typist with a typing speed of

Statistics
ProbabilitySuppose that fundraisers at a university call recent graduates to request donations for campus outreach programs They report the following information for last year s graduates Size of donation Proportion of calls 0 40 0 c What is P x 25 10 d What is P x 0 25 50 Three attempts were made to contact each graduate A donation of 0 was recorded both for those who were contacted but declined to make a donation and for those who were not reached in three attempts Consider the variable x Amount of donation for a person selected at random from the population of last year s graduates of this university a Write a few sentences describing what donation amounts you would expect to see if the value of x was observed for each of 1 000 graduates to donate 10 roughly You would expect roughly of the graduates to donate nothing roughly 50 The frequencies would be close to but not exactly these values The four frequencies would add to 0 35 0 20 0 05 b What is the most common value of x in this population to donate 25 and roughly to donat

Statistics
ProbabilityThe time to assemble a product was recorded for each worker at a company in a sample of 30 A 95 confidence interval for u is 149 156 minutes a The individual object in the study was a randomly selected This is computer graded so use exact wording from the problem above b What was the variable information recorded for each object in the study This is computer graded so use exact wording from the problem above c State the statistical interpretation of the confidence interval in the context of this problem Select an answer company is are between the v d What is the symbol and value of the point estimate for u minutes e What is the margin of error for the given interval time to assemble a product of workers at a and minutes f Fill in the boxes below to show the relation on the number line between the numeric values of the point estimate and the interval estimate for A B C

Statistics
Probabilityparts a through d a Find the probability of choosing all first shift workers Round to four decimal places as needed b Find the probability of choosing all second shift workers Round to four decimal places as needed c Find the probability of choosing exactly six first shift workers Round to four decimal places as needed d Find the probability of choosing exactly four second shift workers Round to four decimal places as needed

Statistics
ProbabilityYou may need to use the appropriate appendix table or technology to answer this question A random sample of 81 credit sales in a department store showed an average sale of 65 00 From past data it is known that the standard deviation of the population is 26 a Determine the standard error of the mean in dollars Round your answer to the nearest cent X 3 b With a 0 95 probability what can be said about the size of the margin of error O There is a 0 95 probability that the distance between the sample mean and the population mean will equal the margin of error O There is a 0 95 probability that the distance between the sample mean and the population mean will be greater than or equal to the margin of error There is a 0 95 probability that the margin of error and the population mean are equal O There is a 0 95 probability that the sample mean and the population mean are equal O There is a 0 95 probability that the distance between the sample mean and the population mean will be less than or equal to the margin of error c What is the 95 confidence interval of the population mean in dollars Round your answers to the nearest cent X 58 9023 X to 71 0977 X

Statistics
Probability2 33 The IRS plans an SRS The Internal Revenue Service plans to examine an SRS of individual federal income tax returns from each state One variable of interest is the proportion of returns claiming itemized deduc tions The total number of tax returns in a state varies from almost 30 million in California to approximately 500 000 in Wyoming a Will the margin of error for estimating the popula tion proportion change from state to state if an SRS of 2000 tax returns is selected in each state Explain your answer b Will the margin of error change from state to state if an SRS of 1 of all tax returns is selected in each ver

Statistics
Probabilitytep 2 39 Order in choice Does the order in which wine is pre sented make a difference Several choices of wine are pre sented one at a time and in sequence and the subject is then asked to choose the preferred wine at the end of the sequence In this study subjects were asked to taste two wine samples in sequence Both samples given to a subject were the same wine although subjects were expecting to taste two different samples of a particular variety Of the 32 subjects in the study 22 selected the wine presented first when presented with two identical wine samples 29 a Do the data give good reason to conclude that the subjects are not equally likely to choose either of the two positions when presented with two identi cal wine samples in sequence b The subjects were recruited in Ontario Canada via advertisements to participate in a study of at titudes and values toward wine Can we generalize

Statistics
Probability1 Running red survey of 880 drivers asked Recalling the last 10 traf fic lights you drove through how many of them were red when you entered the intersections Of the 880 respondents 171 admitted that at least one light had been red 24 a Give a 95 confidence interval for the proportion of all drivers who ran one or more of the last 10 red lights they met b Nonresponse is a practical problem for this survey only 21 6 of calls that reached a live person were completed Another practical problem is that people may not give truthful answers What is the likely direction of the bias do you think more or fewer than 171 of the 880 respondents really ran a red
Statistics
Probability25 Do smokers know that smoking is bad for them The Harris Poll asked a sample of smokers Do you believe that smoking will probably shorten your life or not Of the 1010 people in the sample 848 said Yes a Harris called residential telephone numbers at ran dom in an attempt to contact an SRS of smokers Based on what you know about national sample surveys what is likely to be the biggest weakness in the survey b We will nonetheless act as if the people interviewed are an SRS of smokers Give a 95 confidence interval for the percent of smokers who agree tha smoking will probably shorten their lives alessandro0770 Getty Images

Statistics
ProbabilityThe pie chart to the right shows how adults rate their financial shape Suppose 18 people are chosen at random from a group of 200 What is the probability that none of the 18 people would rate their financial shape as fair Make the assumption that the 200 people are represented by the pie chart The probability that none of the 18 people would rate their financial shape as fair is Round to six decimal places as needed Excellent 5 Good 44 Fair 36 Poor 13 Other 2

Statistics
ProbabilityYou look over the songs in a jukebox and determine that you like 17 of the 55 songs a What is the probability that you like the next four songs that are played Assume a song cannot be repeated b What is the probability that you do not like the any of the next four songs that are played Assume a song cannot be repeated a The probability that you like the next four songs that are played is Round to three decimal places as needed b The probability that you do not like any of the next four songs that are played is Round to three decimal places as needed IDEERI

Statistics
ProbabilityA certain lottery has 25 numbers In how many different ways can 5 of the numbers be selected Assume that order of selection is not important There are different ways the numbers can be selected Simplify your answer

Statistics
ProbabilityExpress the confidence interval 80 4 8 6 in interval form Express the answer in decimal format do not enter as percents
