Probability Questions and Answers
Statistics
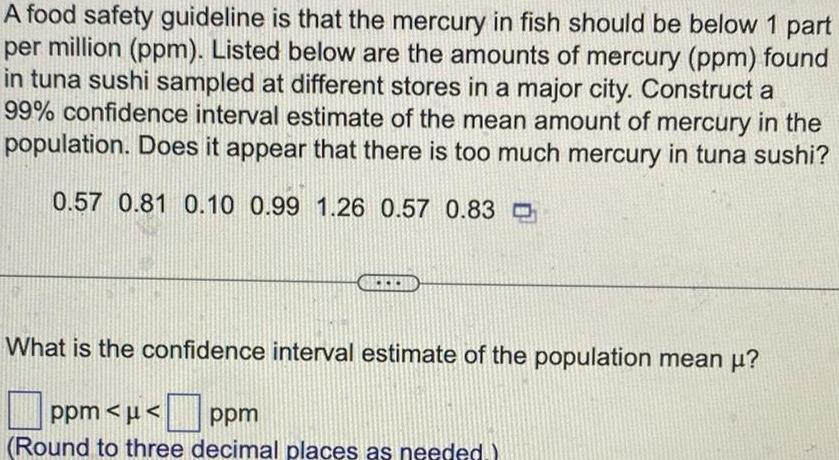
ProbabilityA food safety guideline is that the mercury in fish should be below 1 part per million ppm Listed below are the amounts of mercury ppm found in tuna sushi sampled at different stores in a major city Construct a 99 confidence interval estimate of the mean amount of mercury in the population Does it appear that there is too much mercury in tuna sushi 0 57 0 81 0 10 0 99 1 26 0 57 0 83 What is the confidence interval estimate of the population mean ppm ppm Round to three decimal places as needed
Statistics
ProbabilityIn a science fair project Emily conducted an experiment in which she tested professional touch therapists to see if they could sense her energy field She flipped a coin to select either her right hand or her left hand and then she asked the therapists to identify the selected hand by placing their hand just under Emily s hand without seeing it and without touching it Among 350 trials the touch therapists were correct 169 times Complete parts a through d a Given that Emily used a coin toss to select either her right hand or her left hand what proportion of correct responses would be expected if the touch therapists made random guesses Type an integer or a decimal Do not round
Statistics
ProbabilityKeep working Getting things wrong is part of learning 1 point Cans of regular Coke are labeled as containing 12 oz Statistics students weighted the content of 8 randomly chosen cans and found the mean weight to be 12 1 Assume that cans of Coke are filled so that the actual amounts are normally distributed with a mean of 12 00 oz and a standard deviation of sign 0 12 oz Find the probability that a sample of 8 cans will have a mean amount of at least 12 1 oz Hint If you have the population standard deviation which you do in this case you can use the normal distribution instead of the T distribution
Statistics
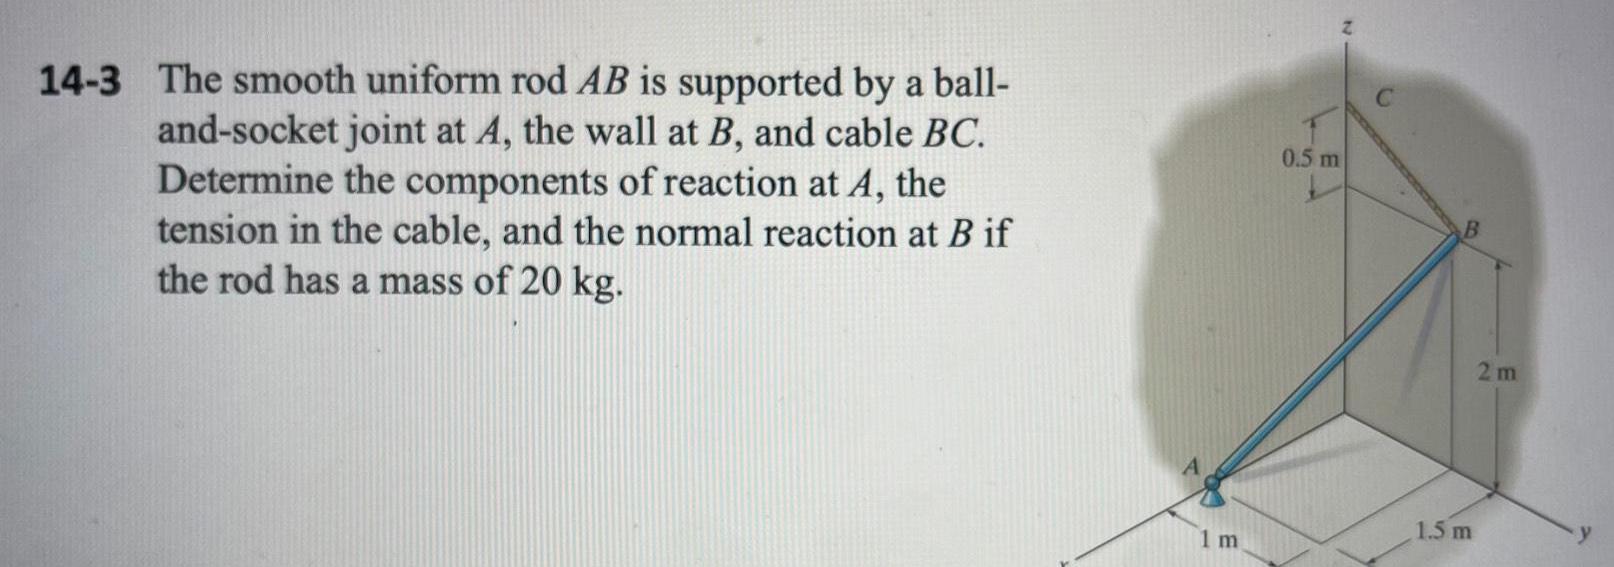
Probability14 3 The smooth uniform rod AB is supported by a ball and socket joint at A the wall at B and cable BC Determine the components of reaction at A the tension in the cable and the normal reaction at B if the rod has a mass of 20 kg 1 m 0 5 m B 1 5 m 2m y
Statistics
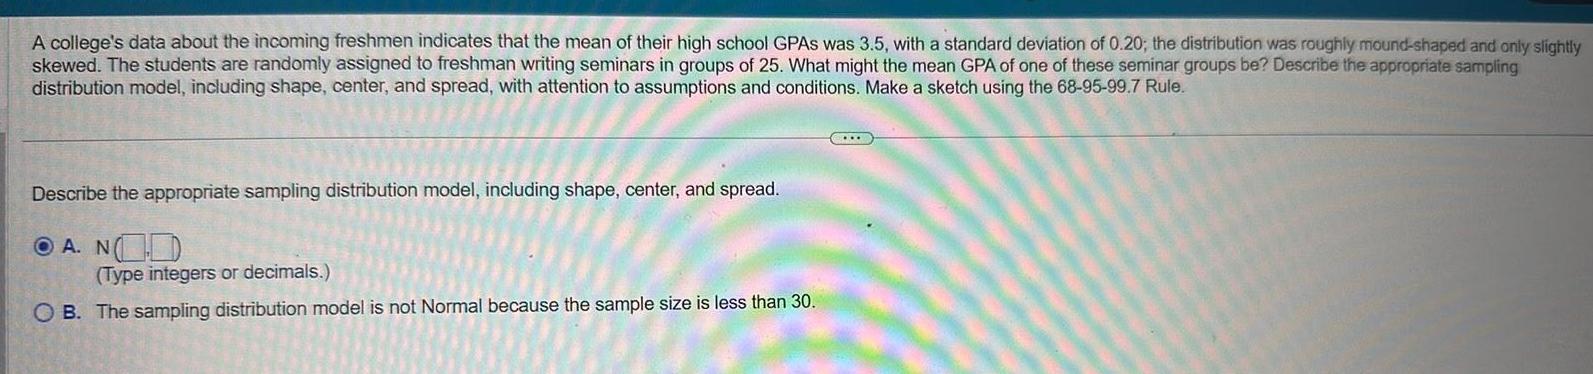
ProbabilityA college s data about the incoming freshmen indicates that the mean of their high school GPAS was 3 5 with a standard deviation of 0 20 the distribution was roughly mound shaped and only slightly skewed The students are randomly assigned to freshman writing seminars in groups of 25 What might the mean GPA of one of these seminar groups be Describe the appropriate sampling distribution model including shape center and spread with attention to assumptions and conditions Make a sketch using the 68 95 99 7 Rule Describe the appropriate sampling distribution model including shape center and spread A N Type integers or decimals OB The sampling distribution model is not Normal because the sample size is less than 30 GULD
Statistics
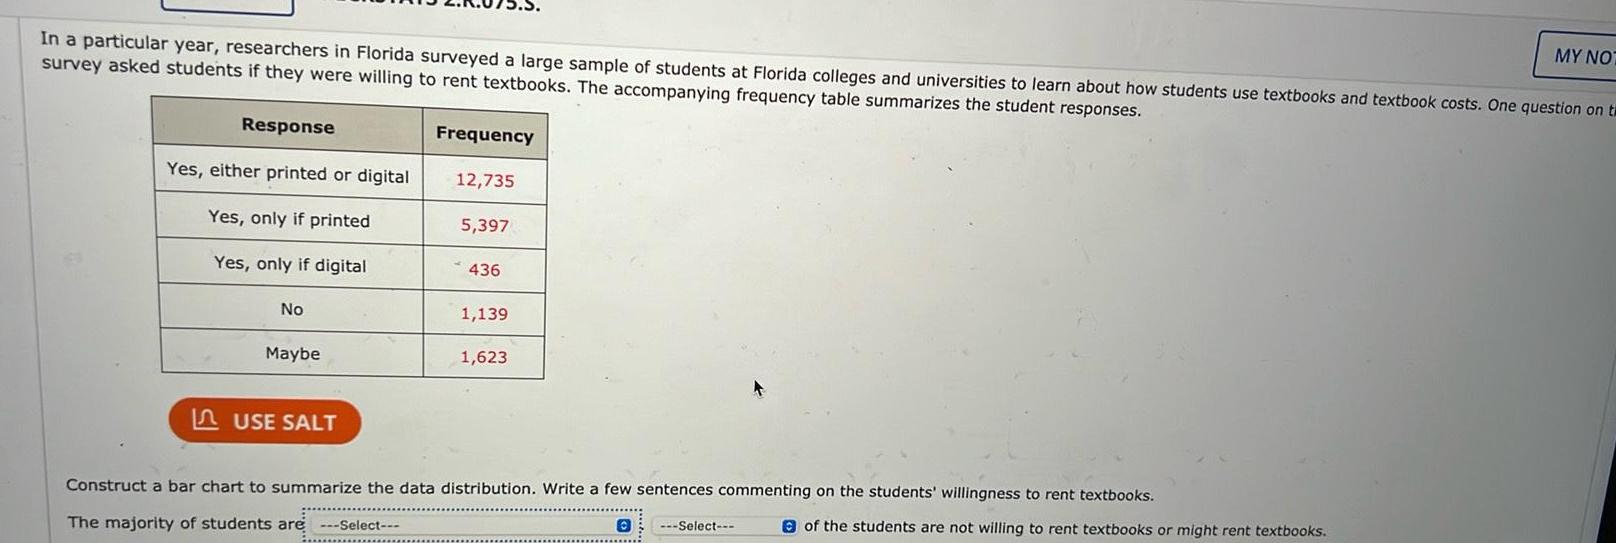
ProbabilityIn a particular year researchers in Florida surveyed a large sample of students at Florida colleges and universities to learn about how students use textbooks and textbook costs One question on t survey asked students if they were willing to rent textbooks The accompanying frequency table summarizes the student responses Response Yes either printed or digital Yes only if printed Yes only if digital No Maybe USE SALT Frequency 12 735 5 397 436 1 139 1 623 Construct a bar chart to summarize the data distribution Write a few sentences commenting on the students willingness to rent textbooks The majority of students are Select 0 Select of the students are not willing to rent textbooks or might rent textbooks MY NOT
Statistics
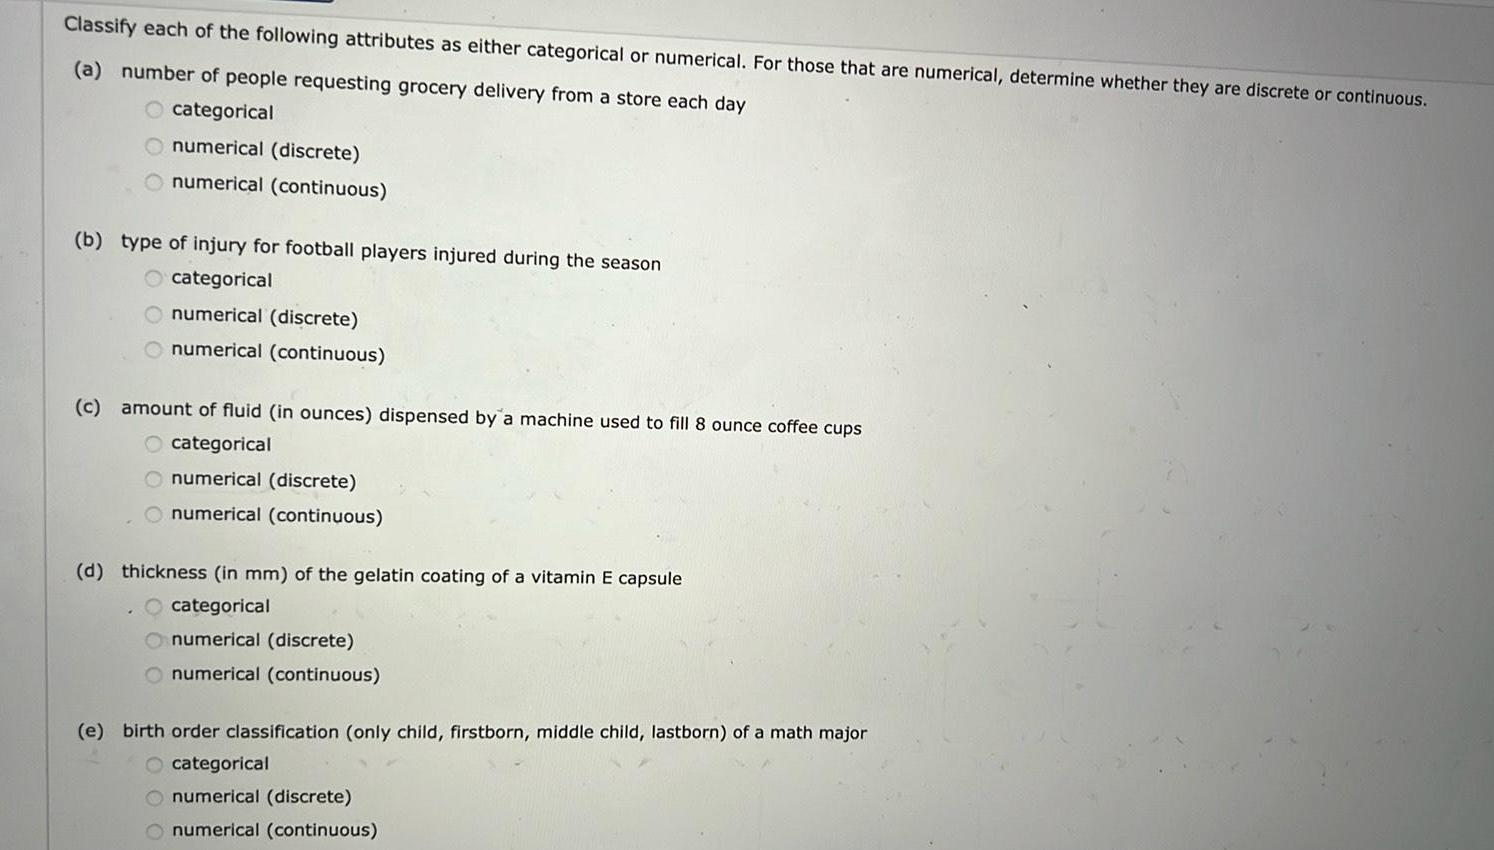
ProbabilityClassify each of the following attributes as either categorical or numerical For those that are numerical determine whether they are discrete or continuous a number of people requesting grocery delivery from a store each day O categorical numerical discrete numerical continuous b type of injury for football players injured during the season categorical O numerical discrete numerical continuous c amount of fluid in ounces dispensed by a machine used to fill 8 ounce coffee cups O categorical numerical discrete numerical continuous d thickness in mm of the gelatin coating of a vitamin E capsule categorical numerical discrete numerical continuous e birth order classification only child firstborn middle child lastborn of a math major O categorical O numerical discrete O numerical continuous
Statistics
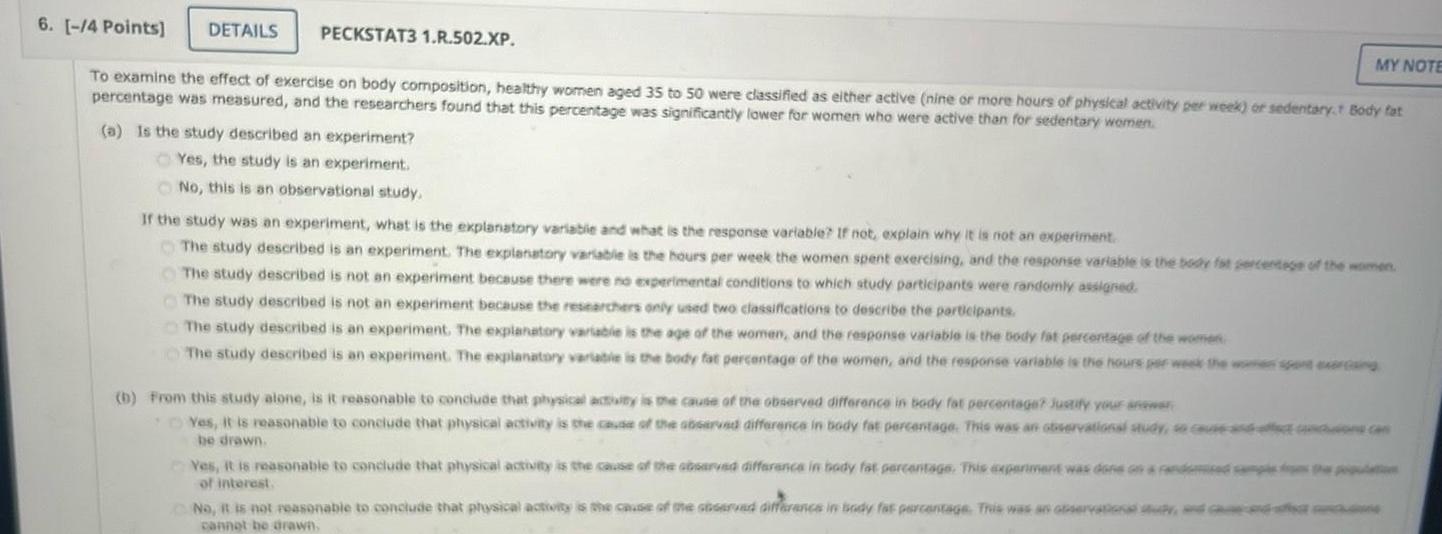
Probability6 4 Points DETAILS PECKSTAT3 1 R 502 XP To examine the effect of exercise on body composition healthy women aged 35 to 50 were classified as either active nine or more hours of physical activity per week or sedentary Body fat percentage was measured and the researchers found that this percentage was significantly lower for women who were active than for sedentary women a Is the study described an experiment Yes the study is an experiment No this is an observational study If the study was an experiment what is the explanatory variable and what is the response variable If not explain why it is not an experiment The study described is an experiment The explanatory variable is the hours per week the women spent exercising and the response variable is the body fat percentage of the women The study described is not an experiment because there were no experimental conditions to which study participants were randomly assigned MY NOTE The study described is not an experiment because the researchers only used two classifications to describe the participants The study described is an experiment The explanatory variable is the age of the women and the response variable is the body fat percentage of the women The study described is an experiment The explanatory variable is the body fat percentage of the women and the response variable is the hours per week the women spent exig b From this study alone is it reasonable to conclude that physical activity is the cause of the observed difference in body fat percentage Justify your answer Yes it is reasonable to conclude that physical activity is the cause of the observed difference in body fat percentage This was an observational study so cause and effect be drawn Yes it is reasonable to conclude that physical activity is the cause of the observed difference in body fat percentage This experiment was done on a randomized camps of interest No it is not reasonable to conclude that physical activity is the cause of the observed difference in body fat percentage This was an observational study and c cannot be drawn one can the population
Statistics
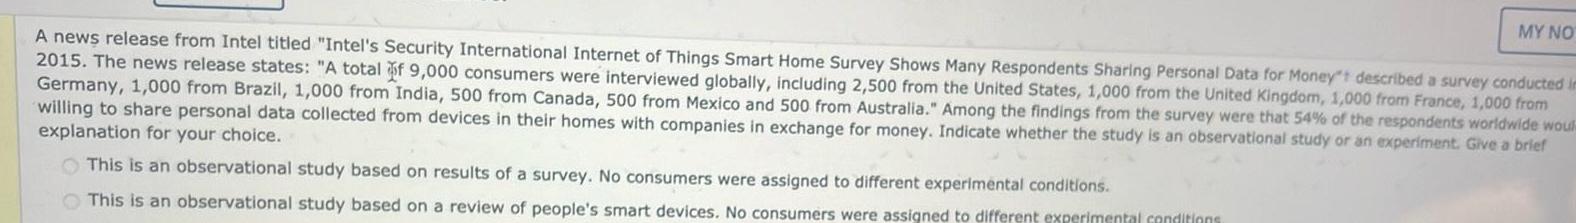
ProbabilityMY NO A news release from Intel titled Intel s Security International Internet of Things Smart Home Survey Shows Many Respondents Sharing Personal Data for Money t described a survey conducted in 2015 The news release states A total of 9 000 consumers were interviewed globally including 2 500 from the United States 1 000 from the United Kingdom 1 000 from France 1 000 from Germany 1 000 from Brazil 1 000 from India 500 from Canada 500 from Mexico and 500 from Australia Among the findings from the survey were that 54 of the respondents worldwide woul willing to share personal data collected from devices in their homes with companies in exchange for money Indicate whether the study is an observational study or an experiment Give a brief explanation for your choice This is an observational study based on results of a survey No consumers were assigned to different experimental conditions This is an observational study based on a review of people s smart devices No consumers were assigned to different experimental conditions
Statistics
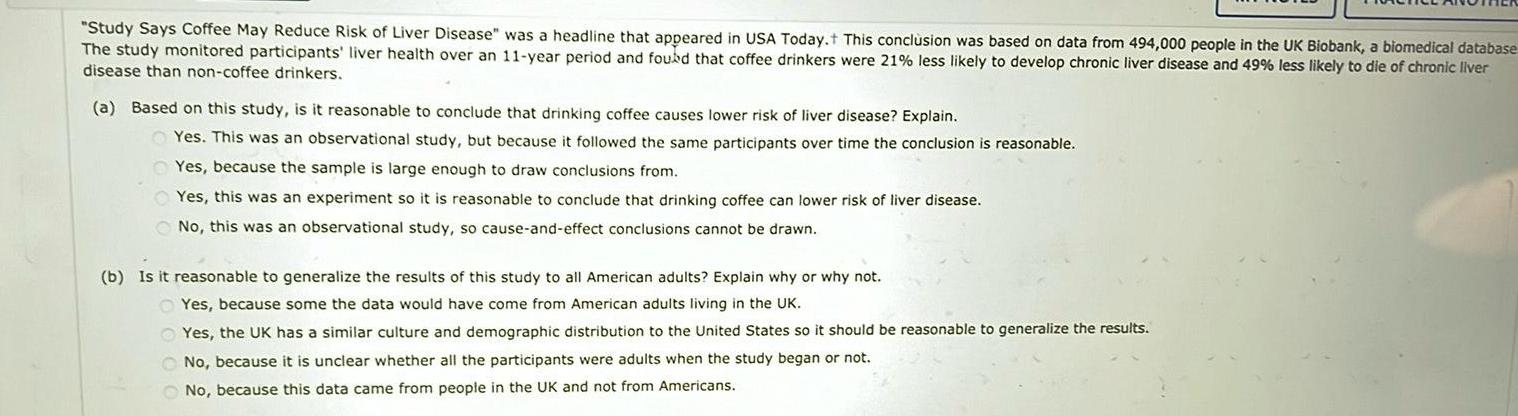
ProbabilityStudy Says Coffee May Reduce Risk of Liver Disease was a headline that appeared in USA Today This conclusion was based on data from 494 000 people in the UK Biobank a biomedical database The study monitored participants liver health over an 11 year period and found that coffee drinkers were 21 less likely to develop chronic liver disease and 49 less likely to die of chronic liver disease than non coffee drinkers a Based on this study is it reasonable to conclude that drinking coffee causes lower risk of liver disease Explain Yes This was an observational study but because it followed the same participants over time the conclusion is reasonable Yes because the sample is large enough to draw conclusions from Yes this was an experiment so it is reasonable to conclude that drinking coffee can lower risk of liver disease No this was an observational study so cause and effect conclusions cannot be drawn b Is it reasonable to generalize the results of this study to all American adults Explain why or why not Yes because some the data would have come from American adults living in the UK Yes the UK has a similar culture and demographic distribution to the United States so it should be reasonable to generalize the results No because it is unclear whether all the participants were adults when the study began or not No because this data came from people in the UK and not from Americans
Statistics
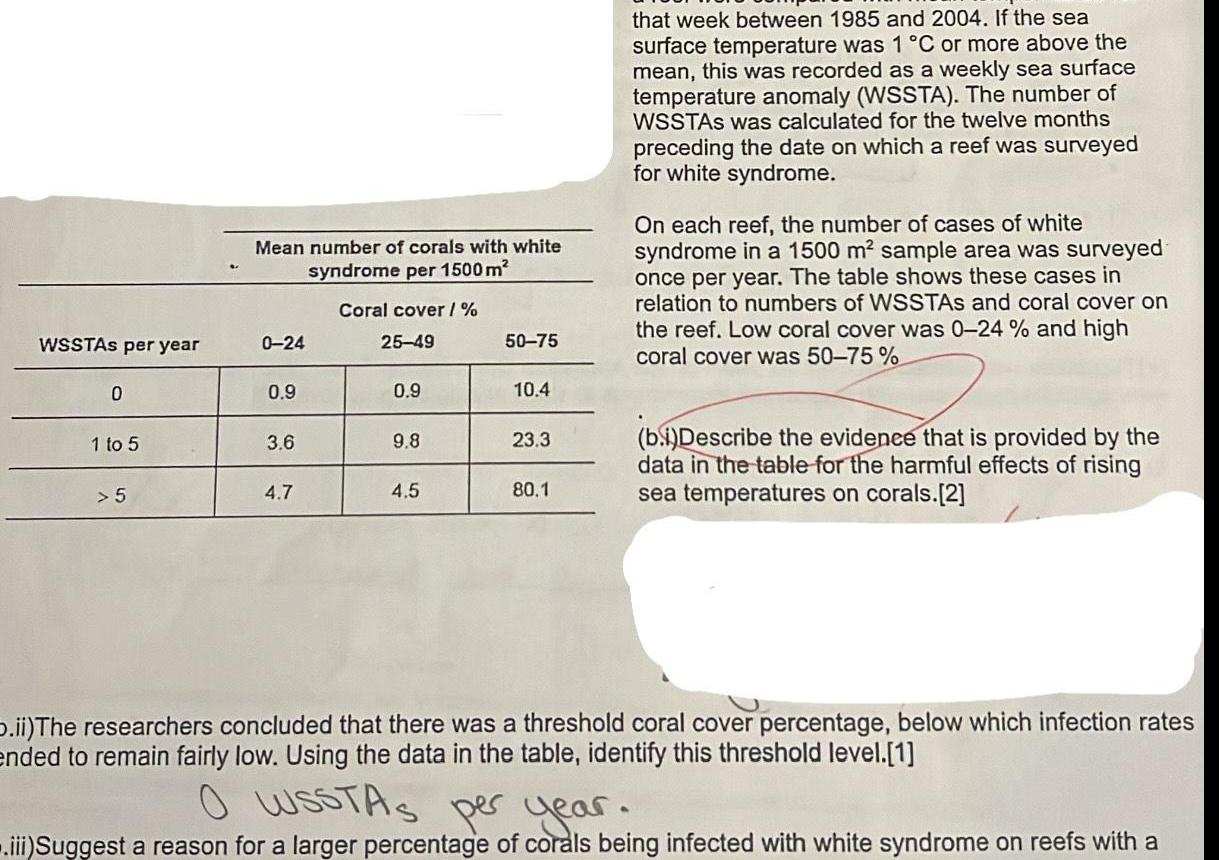
ProbabilityWSSTAs per year 0 1 to 5 5 Mean number of corals with white syndrome per 1500 m 0 24 0 9 3 6 4 7 Coral cover 25 49 0 9 9 8 4 5 50 75 10 4 23 3 80 1 that week between 1985 and 2004 If the sea surface temperature was 1 C or more above the mean this was recorded as a weekly sea surface temperature anomaly WSSTA The number of WSSTAS was calculated for the twelve months preceding the date on which a reef was surveyed for white syndrome On each reef the number of cases of white syndrome in a 1500 m sample area was surveyed once per year The table shows these cases in relation to numbers of WSSTAS and coral cover on the reef Low coral cover was 0 24 and high coral cover was 50 75 b i Describe the evidence that is provided by the data in the table for the harmful effects of rising sea temperatures on corals 2 D ii The researchers concluded that there was a threshold coral cover percentage below which infection rates ended to remain fairly low Using the data in the table identify this threshold level 1 O WSSTAS per year iii Suggest a reason for a larger percentage of corals being infected with white syndrome on reefs with a
Statistics
ProbabilitySuppose you are playing a game with 5 fair dice In the game you roll the 5 dice and record the sum on the dice There are two strategies for winning that you must choose between Strategy 1 You win if you roll any sum between 5 and 10 inclusive meaning including the 5 and the 10 or any sum between 25 and 30 inclusive meaning including the 25 and the 30 Strategy 2 You win if you roll a sum of 17 18 or 19 In order to choose your winning strategy simulate the rolls of the dice First roll the 5 fair dice 1000 times and store the results in C1 C5 Next calculate the sum on the fair dice using Row Statistics to sum C1 C5 and store the results in C6 Create a Histogram of the sums in C6 and save the graph as Fig1 png in your preferred local folder Using Fig1 png answer which one of the following statement is true OI The histogram of the sum of the fair dice is skewed to the right II The histogram of the sum of the fair dice is roughly symmetric III The histogram of the sum of the fair dice is skewed to the left OV None of the above
Statistics
ProbabilitySuppose you are playing a game with 5 fair dice In the game you roll the 5 dice and record the sum on the dice There are two strategies for winning that you must choose between Strategy 1 You win if you roll any sum between 5 and 10 inclusive meaning including the 5 and the 10 or any sum between 25 and 30 inclusive meaning including the 25 and the 30 Strategy 2 You win if you roll a sum of 17 18 or 19 In order to choose your winning strategy simulate the rolls of the dice First roll the 5 fair dice 1000 times and store the results in C1 C5 Next calculate the sum on the fair dice using Row Statistics to sum C1 C5 and store the results in C6 Create a Histogram of the sums in C6 and save the graph as Fig1 png in your preferred local folder Using Fig1 png answer which one of the following statement is true OI The histogram of the sum of the fair dice is skewed to the right II The histogram of the sum of the fair dice is roughly symmetric III The histogram of the sum of the fair dice is skewed to the left IV None of the above QUESTION 2 From Question 1 calculate the experimental probabilities for the 2 strategies Based on your findings which one of the following strategies is the better strategy 1 Strategy 1 II Strategy 2 III Both Strategies are equivalent IV None of the
Statistics
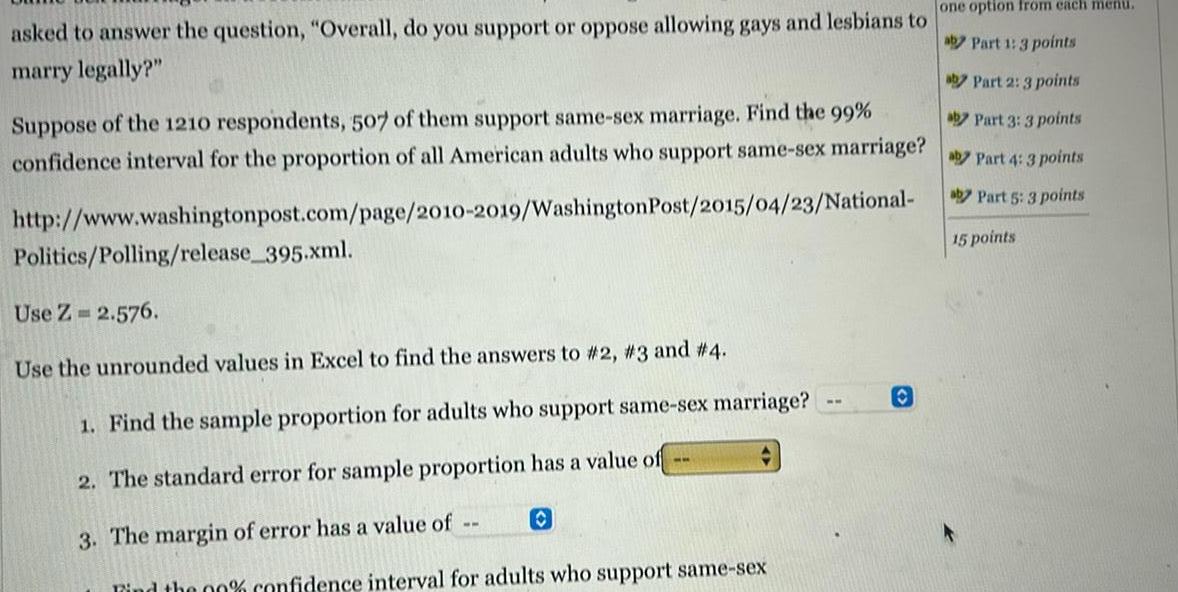
Probabilityasked to answer the question Overall do you support or oppose allowing gays and lesbians to marry legally aby Part 2 3 points aby Part 3 3 points Suppose of the 1210 respondents 507 of them support same sex marriage Find the 99 confidence interval for the proportion of all American adults who support same sex marriage Part 4 3 points aby Part 5 3 points http www washingtonpost com page 2010 2019 Washington Post 2015 04 23 National 15 points Politics Polling release 395 xml Use Z 2 576 Use the unrounded values in Excel to find the answers to 2 3 and 4 1 Find the sample proportion for adults who support same sex marriage 2 The standard error for sample proportion has a value of 3 The margin of error has a value of O Find the 00 confidence interval for adults who support same sex ww one option from each menu aby Part 1 3 points O
Statistics
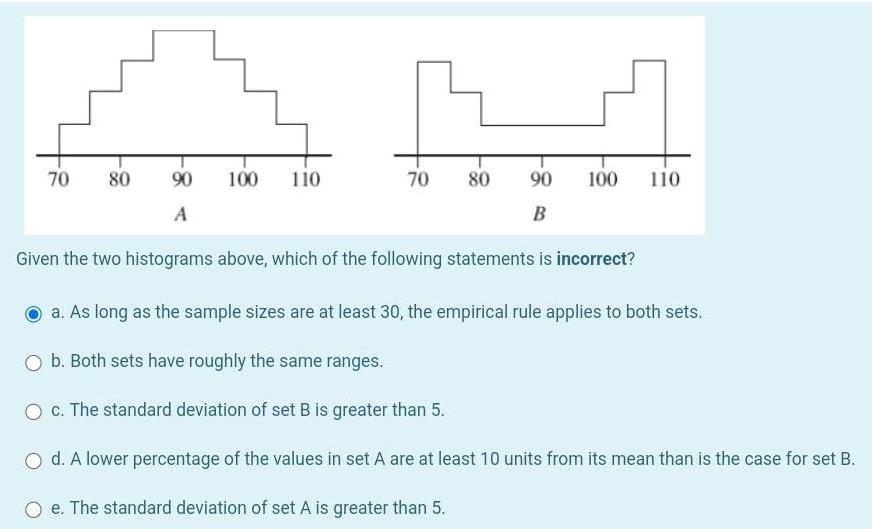
Probability70 80 90 100 A 110 70 80 90 B 100 110 Given the two histograms above which of the following statements is incorrect a As long as the sample sizes are at least 30 the empirical rule applies to both sets b Both sets have roughly the same ranges O c The standard deviation of set B is greater than 5 O d A lower percentage of the values in set A are at least 10 units from its mean than is the case for set B O e The standard deviation of set A is greater than 5
Statistics
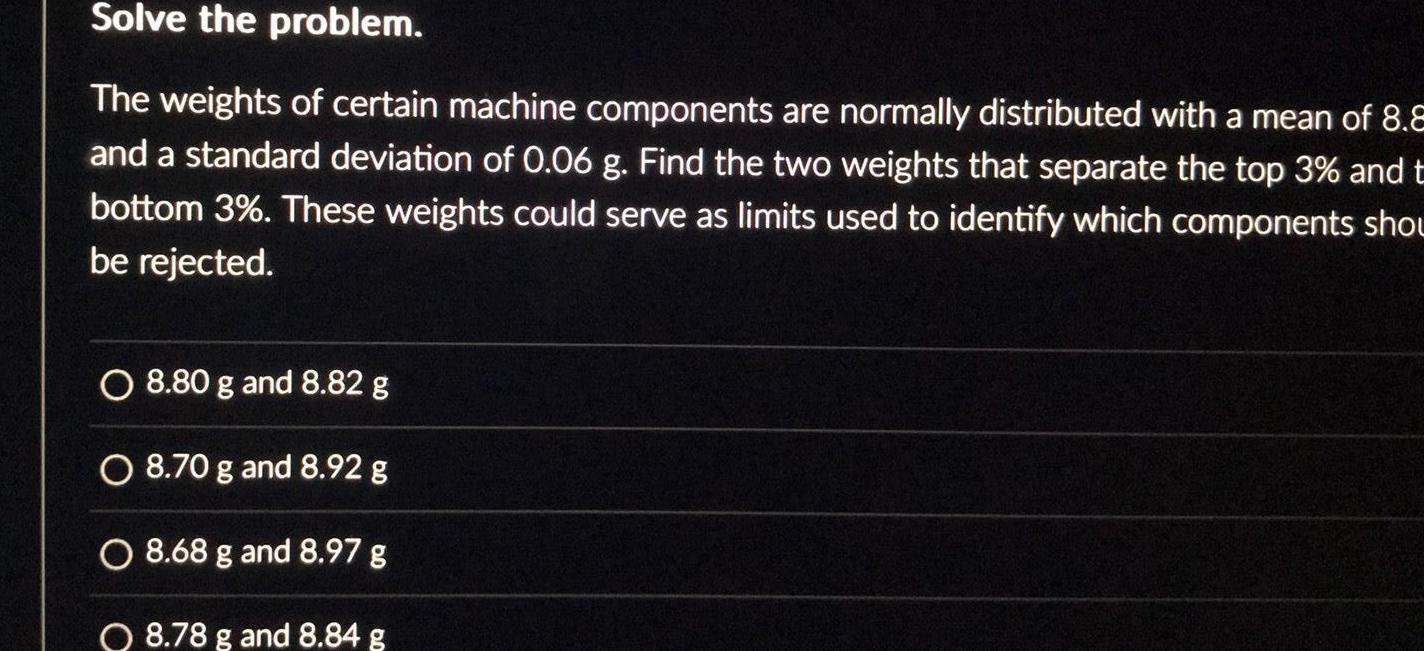
ProbabilitySolve the problem The weights of certain machine components are normally distributed with a mean of 8 8 and a standard deviation of 0 06 g Find the two weights that separate the top 3 and t bottom 3 These weights could serve as limits used to identify which components shou be rejected O 8 80 g and 8 82 g O 8 70 g and 8 92 g O 8 68 g and 8 97 g O 8 78 g and 8 84 g
Statistics
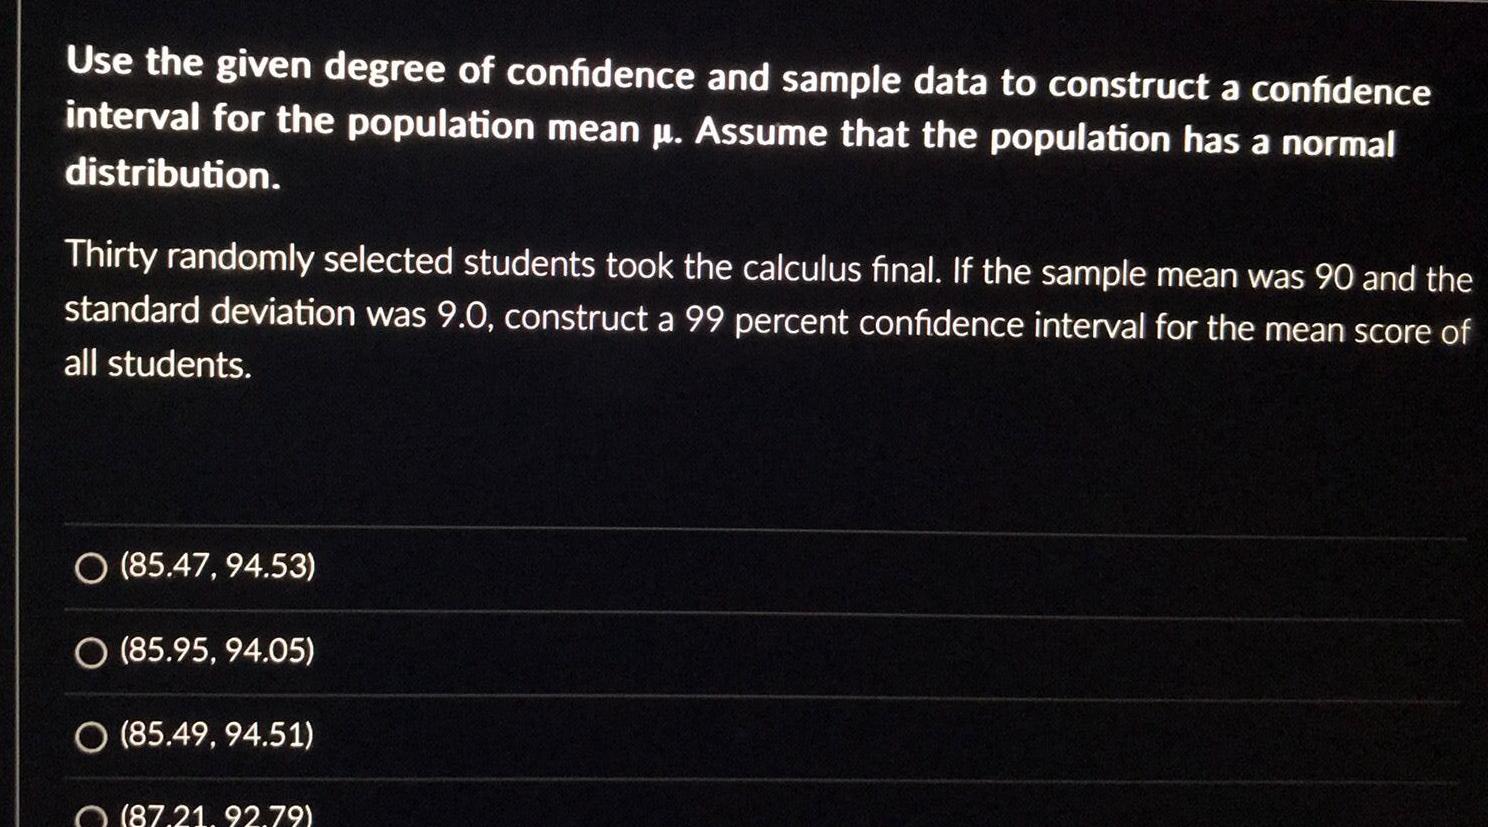
ProbabilityUse the given degree of confidence and sample data to construct a confidence interval for the population mean Assume that the population has a normal distribution Thirty randomly selected students took the calculus final If the sample mean was 90 and the standard deviation was 9 0 construct a 99 percent confidence interval for the mean score of all students O 85 47 94 53 O 85 95 94 05 O 85 49 94 51 87 21 92 79
Statistics
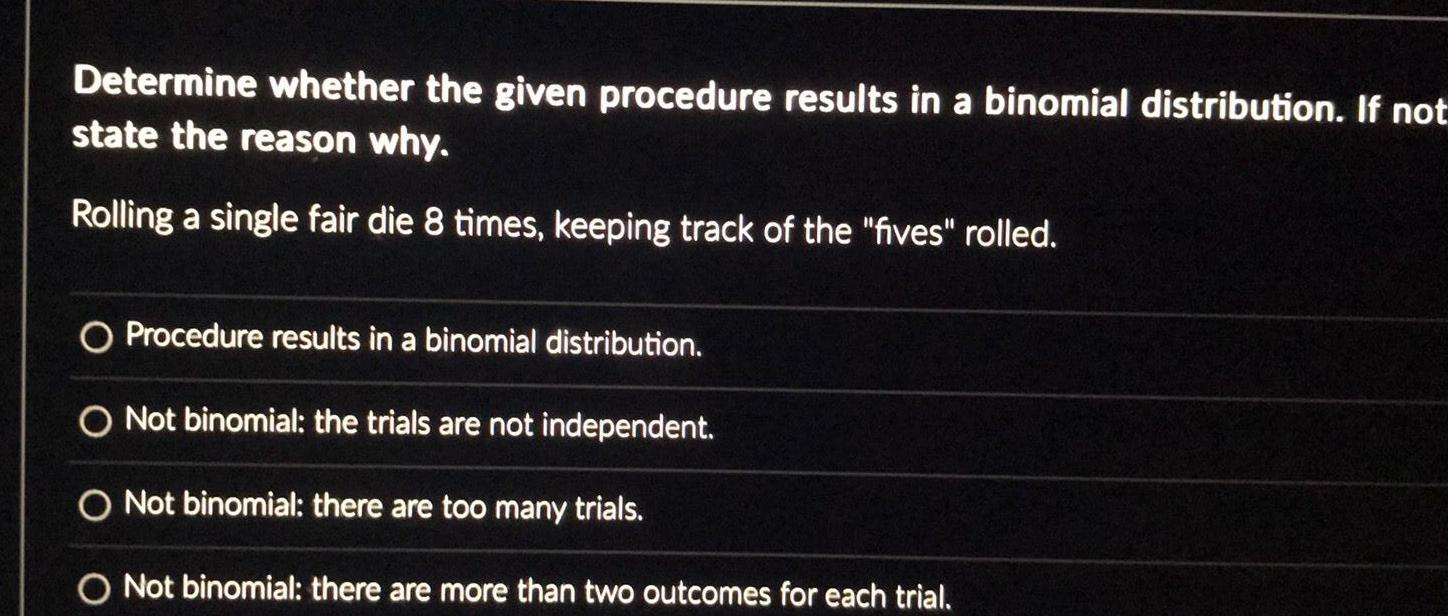
ProbabilityDetermine whether the given procedure results in a binomial distribution If not state the reason why Rolling a single fair die 8 times keeping track of the fives rolled O Procedure results in a binomial distribution O Not binomial the trials are not independent O Not binomial there are too many trials O Not binomial there are more than two outcomes for each trial
Statistics
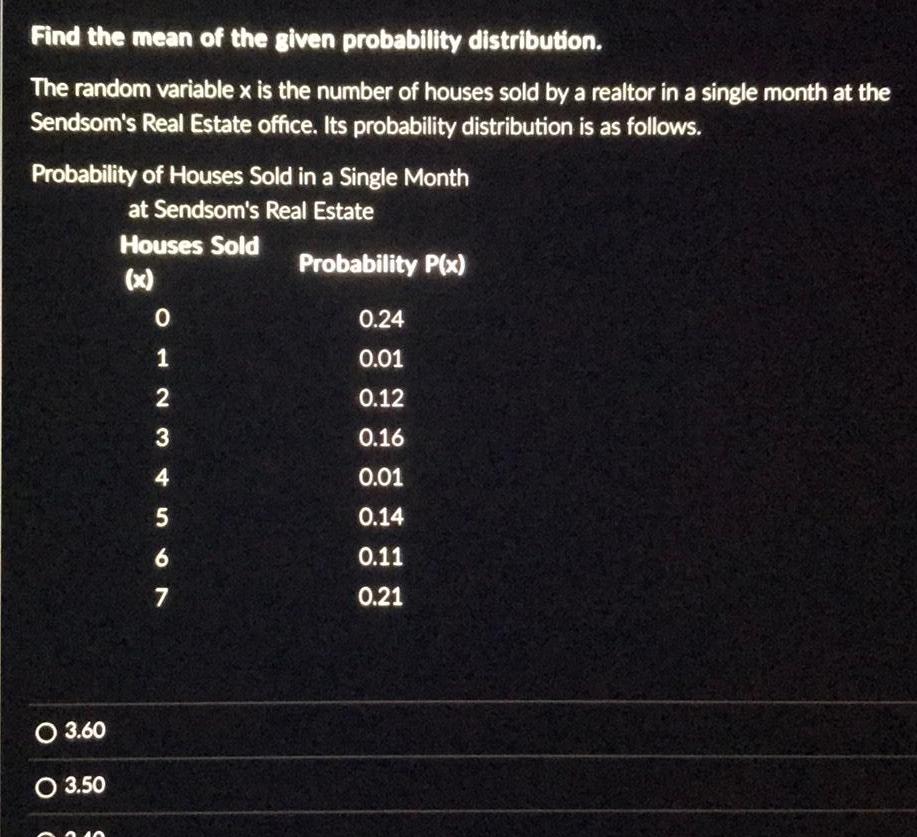
ProbabilityFind the mean of the given probability distribution The random variable x is the number of houses sold by a realtor in a single month at the Sendsom s Real Estate office Its probability distribution is as follows Probability of Houses Sold in a Single Month at Sendsom s Real Estate Houses Sold x O 3 60 O 3 50 012 3 4 567 Probability P x 0 24 0 01 0 12 0 16 0 01 0 14 0 11 0 21
Statistics
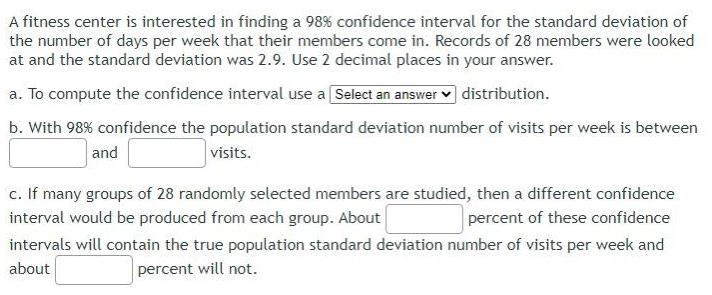
ProbabilityA fitness center is interested in finding a 98 confidence interval for the standard deviation of the number of days per week that their members come in Records of 28 members were looked at and the standard deviation was 2 9 Use 2 decimal places in your answer a To compute the confidence interval use a Select an answer distribution b With 98 confidence the population standard deviation number of visits per week is between visits and c If many groups of 28 randomly selected members are studied then a different confidence interval would be produced from each group About percent of these confidence intervals will contain the true population standard deviation number of visits per week and about percent will not
Statistics
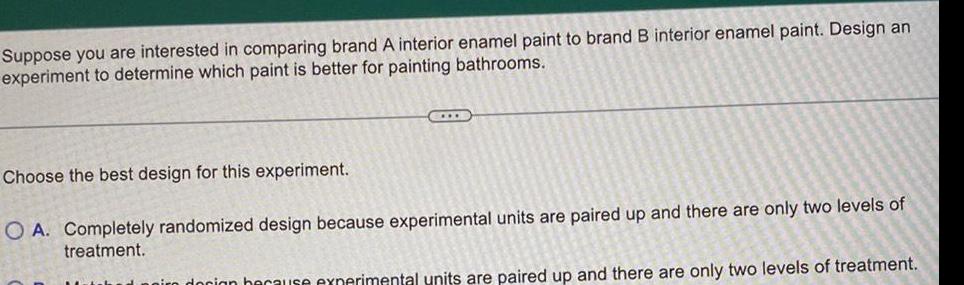
ProbabilitySuppose you are interested in comparing brand A interior enamel paint to brand B interior enamel paint Design an experiment to determine which paint is better for painting bathrooms CIDE Choose the best design for this experiment O A Completely randomized design because experimental units are paired up and there are only two levels of treatment docion because experimental units are paired up and there are only two levels of treatment
Statistics
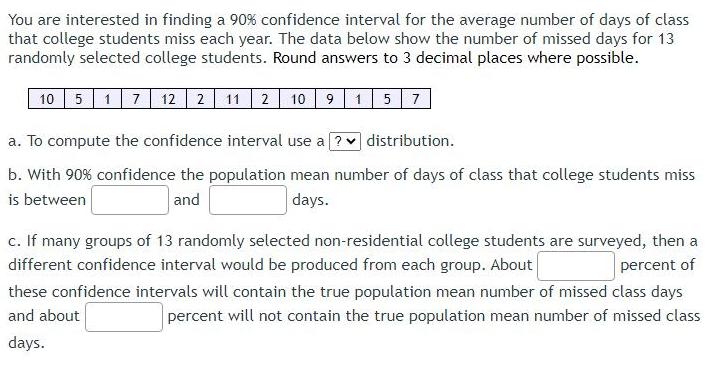
ProbabilityYou are interested in finding a 90 confidence interval for the average number of days of class that college students miss each year The data below show the number of missed days for 13 randomly selected college students Round answers to 3 decimal places where possible 10 5 17 12 2 11 2 10 9 15 7 a To compute the confidence interval use a distribution b With 90 confidence the population mean number of days of class that college students miss is between and days c If many groups of 13 randomly selected non residential college students are surveyed then a different confidence interval would be produced from each group About percent of these confidence intervals will contain the true population mean number of missed class days and about percent will not contain the true population mean number of missed class days
Statistics
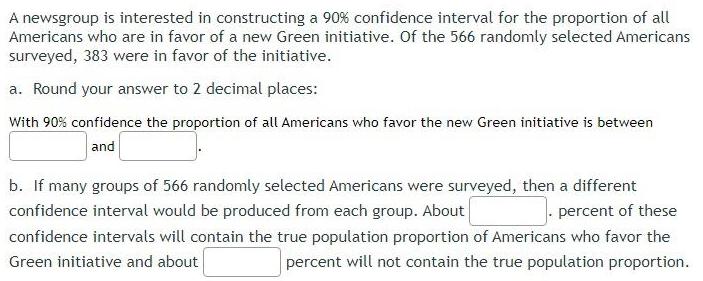
ProbabilityA newsgroup is interested in constructing a 90 confidence interval for the proportion of all Americans who are in favor of a new Green initiative Of the 566 randomly selected Americans surveyed 383 were in favor of the initiative a Round your answer to 2 decimal places With 90 confidence the proportion of all Americans who favor the new Green initiative is between and b If many groups of 566 randomly selected Americans were surveyed then a different confidence interval would be produced from each group About percent of these confidence intervals will contain the true population proportion of Americans who favor the Green initiative and about percent will not contain the true population proportion
Statistics
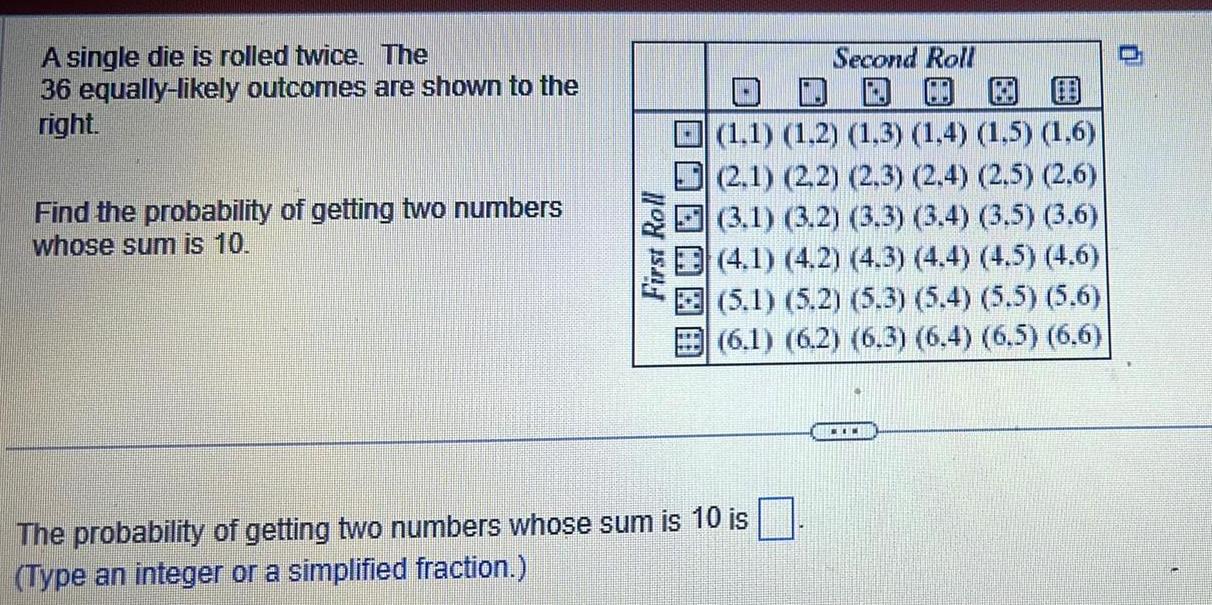
ProbabilityA single die is rolled twice The 36 equally likely outcomes are shown to the right Find the probability of getting two numbers whose sum is 10 First Roll DAAAAA Second Roll DDO 1 1 1 2 1 3 1 4 1 5 1 6 2 1 2 2 2 3 2 4 2 5 2 6 3 1 3 2 3 3 3 4 3 5 3 6 4 1 4 2 4 3 4 4 4 5 4 6 5 1 5 2 5 3 5 4 5 5 5 6 6 1 6 2 6 3 6 4 6 5 6 6 The probability of getting two numbers whose sum is 10 is Type an integer or a simplified fraction I
Statistics
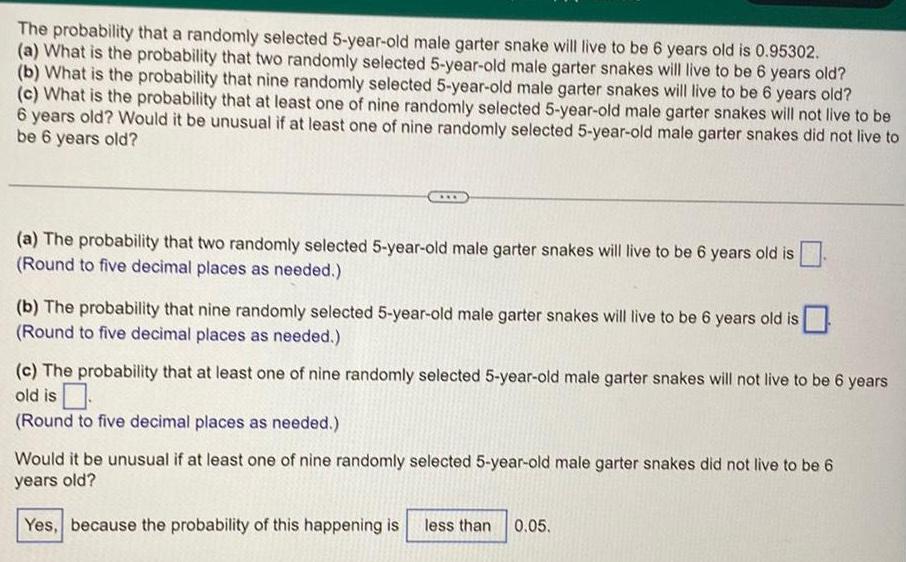
ProbabilityThe probability that a randomly selected 5 year old male garter snake will live to be 6 years old is 0 95302 a What is the probability that two randomly selected 5 year old male garter snakes will live to be 6 years old b What is the probability that nine randomly selected 5 year old male garter snakes will live to be 6 years old c What is the probability that at least one of nine randomly selected 5 year old male garter snakes will not live to be 6 years old Would it be unusual if at least one of nine randomly selected 5 year old male garter snakes did not live to be 6 years old a The probability that two randomly selected 5 year old male garter snakes will live to be 6 years old is Round to five decimal places as needed b The probability that nine randomly selected 5 year old male garter snakes will live to be 6 years old is Round to five decimal places as needed c The probability that at least one of nine randomly selected 5 year old male garter snakes will not live to be 6 years old is Round to five decimal places as needed Would it be unusual if at least one of nine randomly selected 5 year old male garter snakes did not live to be 6 years old Yes because the probability of this happening is less than 0 05
Statistics
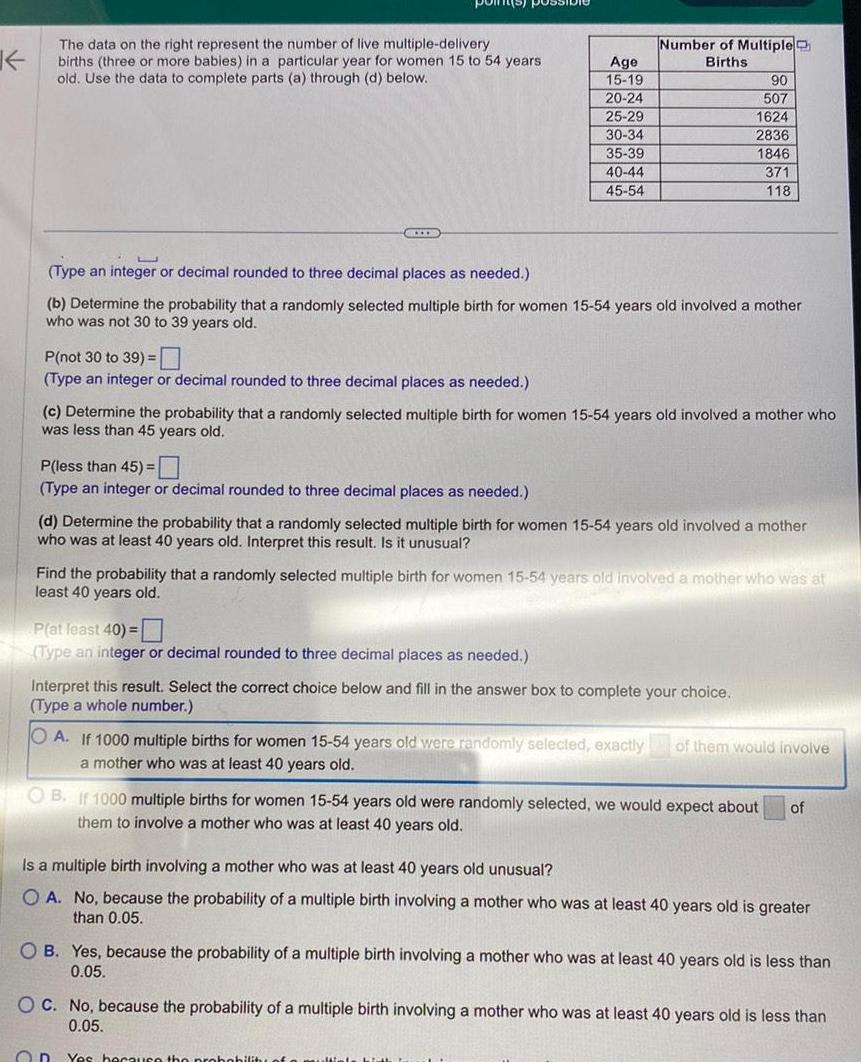
ProbabilityK The data on the right represent the number of live multiple delivery births three or more babies in a particular year for women 15 to 54 years old Use the data to complete parts a through d below HIIB P not 30 to 39 Type an integer or decimal rounded to three decimal places as needed P less than 45 Type an integer or decimal rounded to three decimal places as needed Age 15 19 20 24 25 29 30 34 35 39 40 44 45 54 Type an integer or decimal rounded to three decimal places as needed b Determine the probability that a randomly selected multiple birth for women 15 54 years old involved a mother who was not 30 to 39 years old Number of Multiple Births c Determine the probability that a randomly selected multiple birth for women 15 54 years old involved a mother who was less than 45 years old P at least 40 Type an integer or decimal rounded to three decimal places as needed 90 507 1624 2836 1846 371 118 d Determine the probability that a randomly selected multiple birth for women 15 54 years old involved a mother who was at least 40 years old Interpret this result Is it unusual Find the probability that a randomly selected multiple birth for women 15 54 years old involved a mother who was at least 40 years old Interpret this result Select the correct choice below and fill in the answer box to complete your choice Type a whole number On OA If 1000 multiple births for women 15 54 years old were randomly selected exactly of them would involve a mother who was at least 40 years old OB If 1000 multiple births for women 15 54 years old were randomly selected we would expect about of them to involve a mother who was at least 40 years old Is a multiple birth involving a mother who was at least 40 years old unusual OA No because the probability of a multiple birth involving a mother who was at least 40 years old is greater than 0 05 OB Yes because the probability of a multiple birth involving a mother who was at least 40 years old is less than 0 05 OC No because the probability of a multiple birth involving a mother who was at least 40 years old is less than 0 05 Yes because the probability of a multipl
Statistics
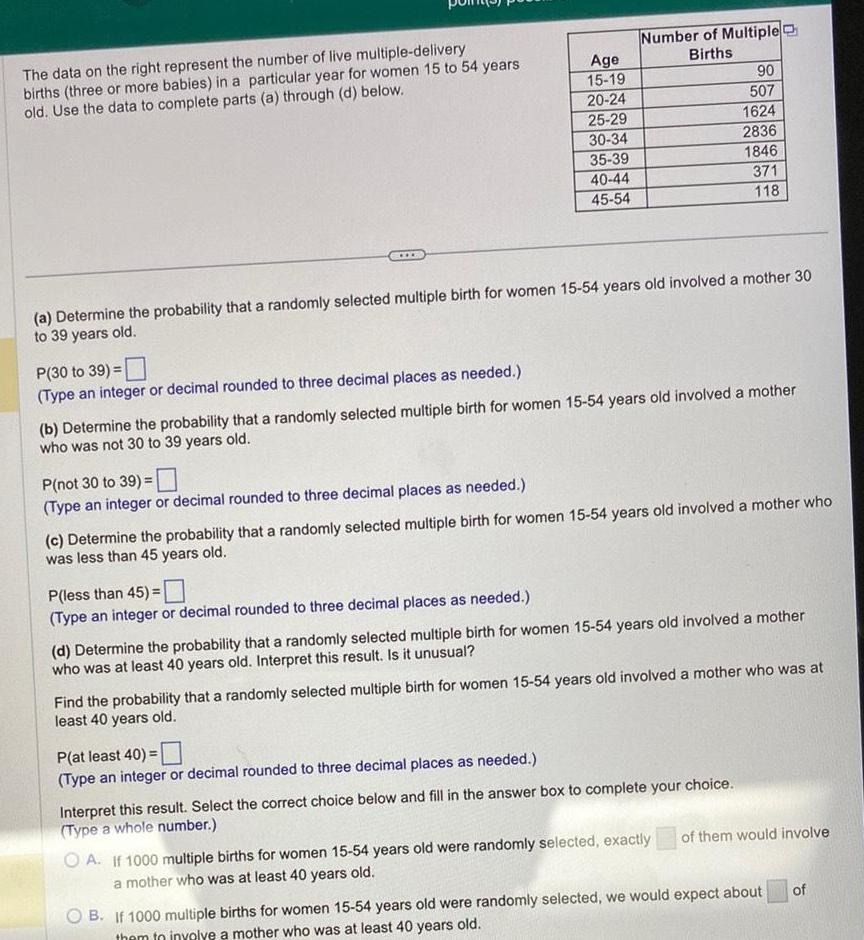
ProbabilityThe data on the right represent the number of live multiple delivery births three or more babies in a particular year for women 15 to 54 years old Use the data to complete parts a through d below P 30 to 39 Type an integer or decimal rounded to three decimal places as needed P not 30 to 39 Type an integer or decimal rounded to three decimal places as needed Age 15 19 20 24 25 29 30 34 a Determine the probability that a randomly selected multiple birth for women 15 54 years old involved a mother 30 to 39 years old P less than 45 Type an integer or decimal rounded to three decimal places as needed 35 39 40 44 45 54 Number of Multiple Births b Determine the probability that a randomly selected multiple birth for women 15 54 years old involved a mother who was not 30 to 39 years old P at least 40 Type an integer or decimal rounded to three decimal places as needed c Determine the probability that a randomly selected multiple birth for women 15 54 years old involved a mother who was less than 45 years old 90 507 1624 2836 1846 371 118 d Determine the probability that a randomly selected multiple birth for women 15 54 years old involved a mother who was at least 40 years old Interpret this result Is it unusual Find the probability that a randomly selected multiple birth for women 15 54 years old involved a mother who was at least 40 years old Interpret this result Select the correct choice below and fill in the answer box to complete your choice Type a whole number OA If 1000 multiple births for women 15 54 years old were randomly selected exactly a mother who was at least 40 years old of them would involve B If 1000 multiple births for women 15 54 years old were randomly selected we would expect about them to involve a mother who was at least 40 years old of
Statistics
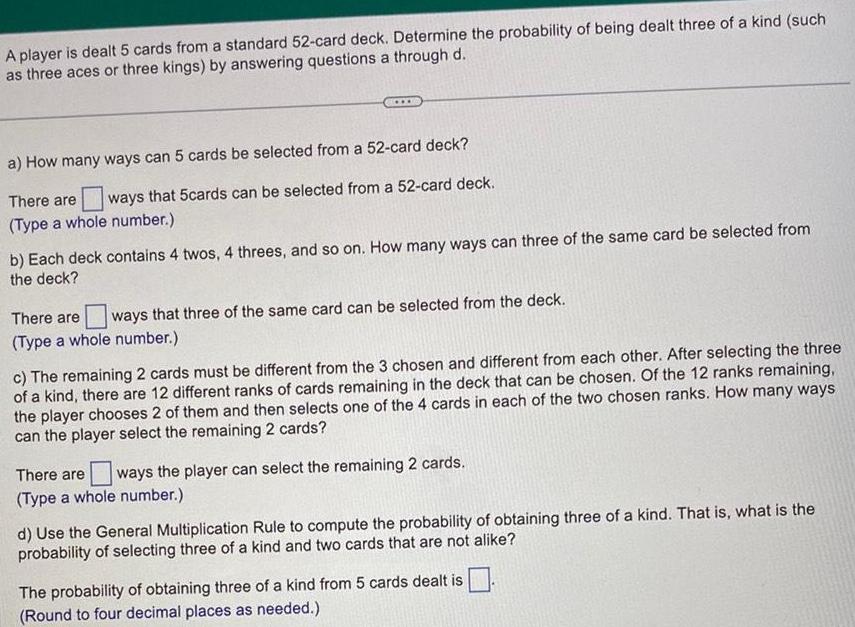
ProbabilityA player is dealt 5 cards from a standard 52 card deck Determine the probability of being dealt three of a kind such as three aces or three kings by answering questions a through d a How many ways can 5 cards be selected from a 52 card deck There are ways that 5cards can be selected from a 52 card deck Type a whole number b Each deck contains 4 twos 4 threes and so on How many ways can three of the same card be selected from the deck There are ways that three of the same card can be selected from the deck Type a whole number c The remaining 2 cards must be different from the 3 chosen and different from each other After selecting the three of a kind there are 12 different ranks of cards remaining in the deck that can be chosen Of the 12 ranks remaining the player chooses 2 of them and then selects one of the 4 cards in each of the two chosen ranks How many ways can the player select the remaining 2 cards There are ways the player can select the remaining 2 cards Type a whole number d Use the General Multiplication Rule to compute the probability of obtaining three of a kind That is what is the probability of selecting three of a kind and two cards that are not alike The probability of obtaining three of a kind from 5 cards dealt is Round to four decimal places as needed
Statistics
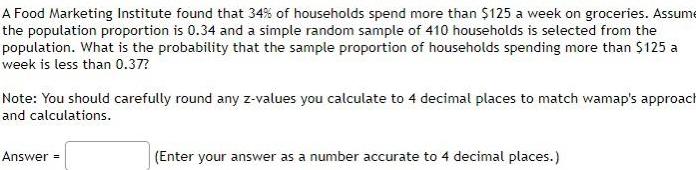
ProbabilityA Food Marketing Institute found that 34 of households spend more than 125 a week on groceries Assume the population proportion is 0 34 and a simple random sample of 410 households is selected from the population What is the probability that the sample proportion of households spending more than 125 a week is less than 0 37 Note You should carefully round any z values you calculate to 4 decimal places to match wamap s approach and calculations Answer Enter your answer as a number accurate to 4 decimal places
Statistics
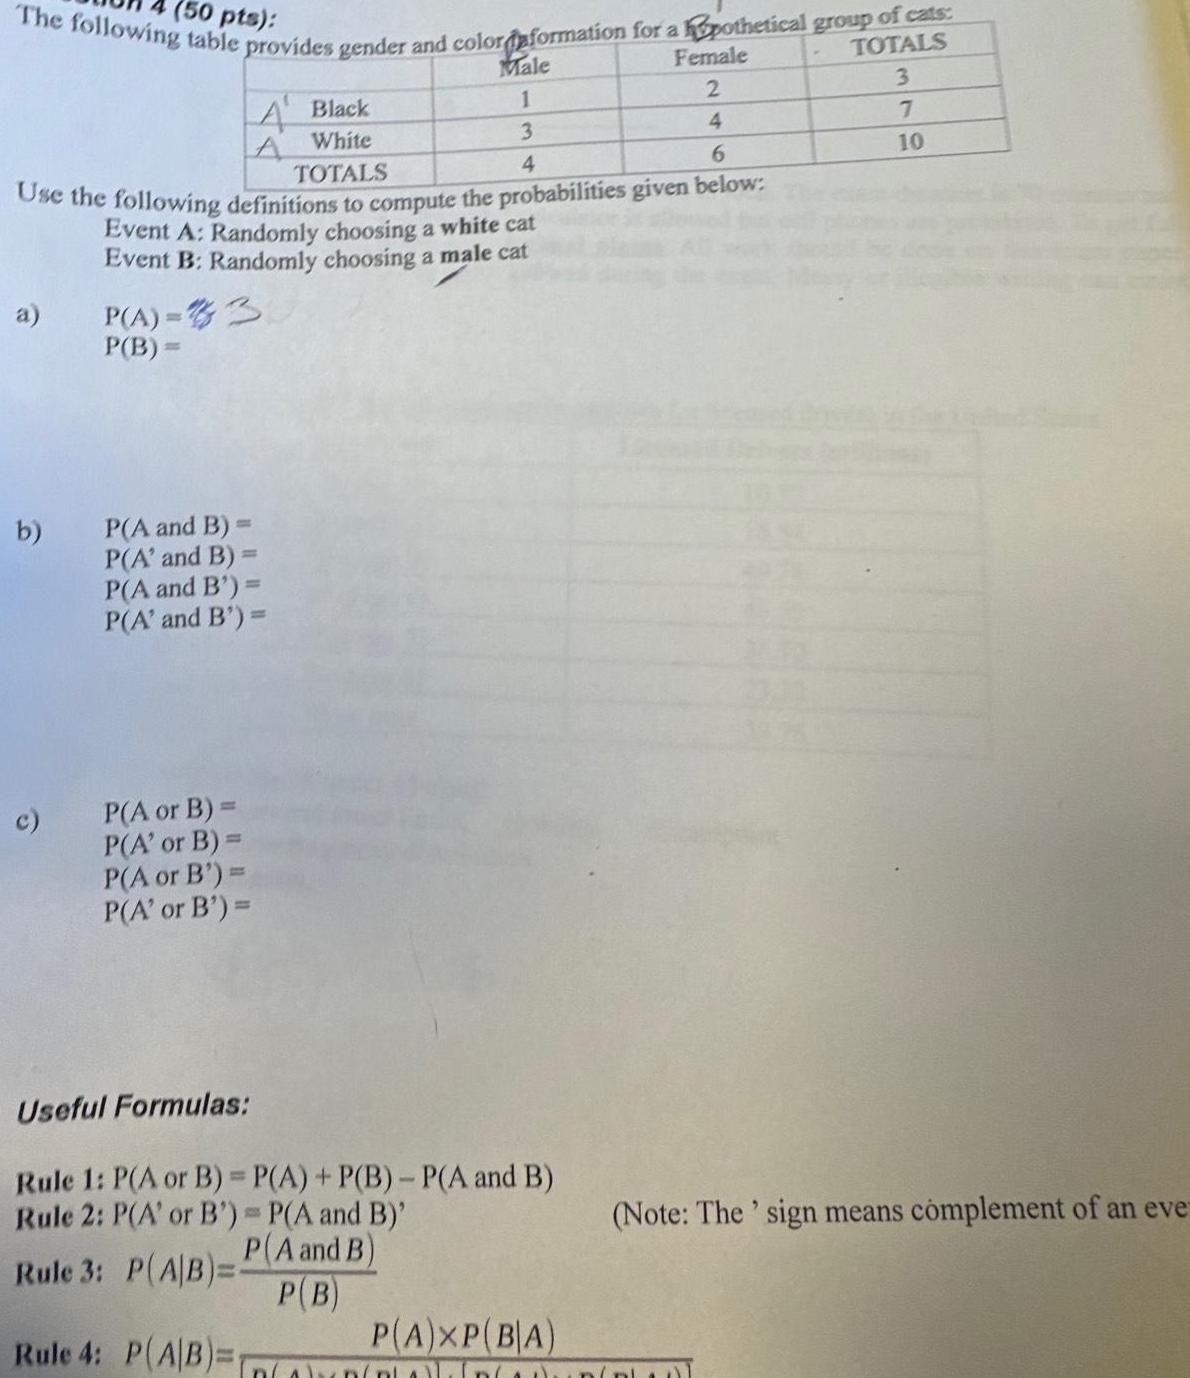
Probability50 pts The following table provides gender and color information for a hypothetical group of cats TOTALS 3 Male Female 1 2 3 4 TOTALS 4 6 Use the following definitions to compute the probabilities given below Event A Randomly choosing a white cat Event B Randomly choosing a male cat a b c A Black A White P A 3 P B P A and B P A and B P A and B P A and B P A or B P A or B P A or B P A or B Useful Formulas Rule 1 P A or B P A P B P A and B Rule 2 P A or B P A and B P A and B Rule 3 P A B P B Rule 4 P A B P A XP BA 7 10 Note The sign means complement of an eve
Statistics
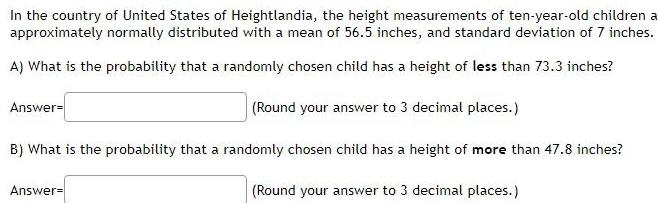
ProbabilityIn the country of United States of Heightlandia the height measurements of ten year old children a approximately normally distributed with a mean of 56 5 inches and standard deviation of 7 inches A What is the probability that a randomly chosen child has a height of less than 73 3 inches Round your answer to 3 decimal places B What is the probability that a randomly chosen child has a height of more than 47 8 inches Round your answer to 3 decimal places Answer Answer
Statistics
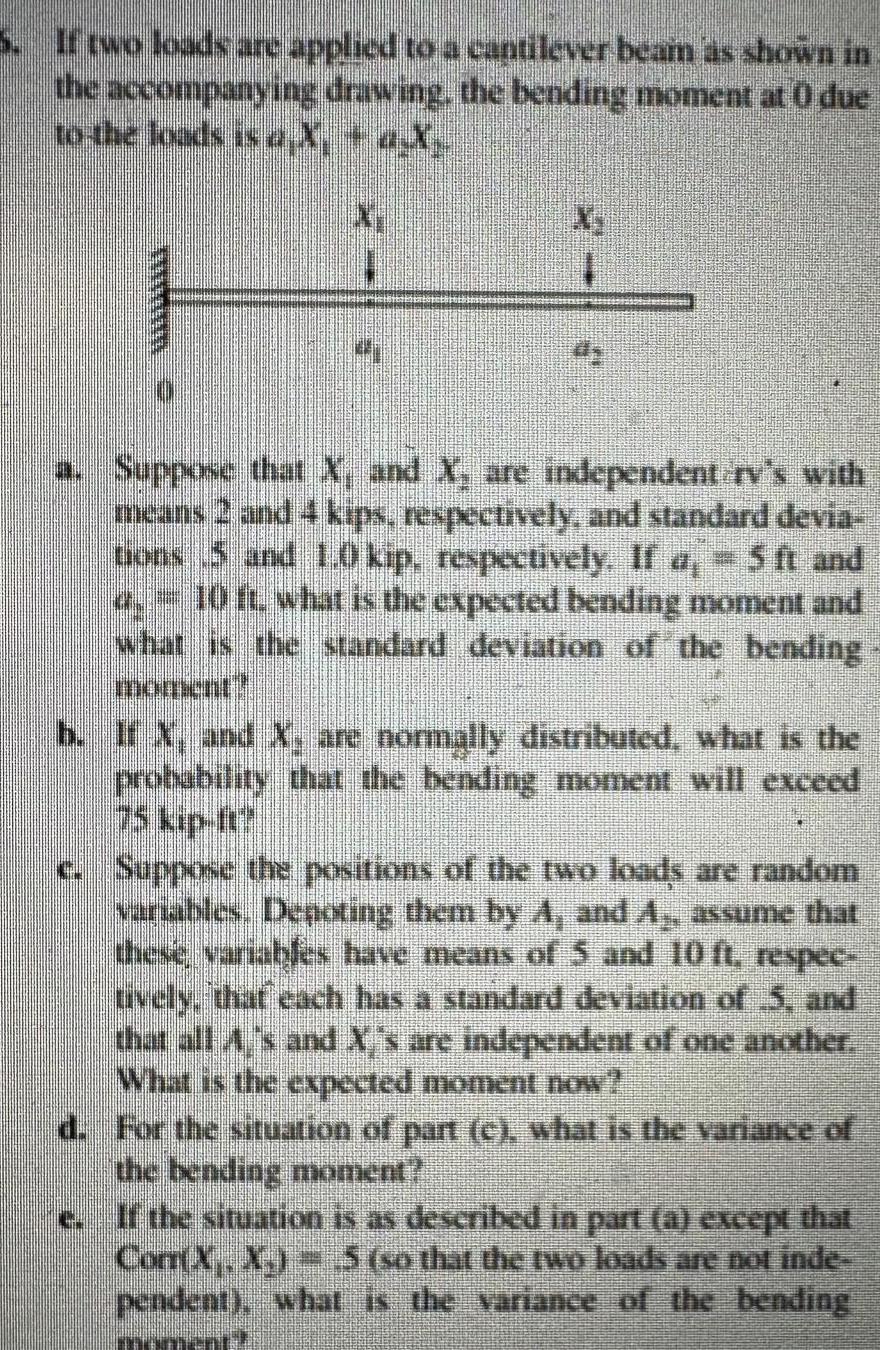
ProbabilityIf two loads are applied to a cantilever beam as shown in the accompanying drawing the bending moment at 0 due to the loads is a X a X mum X a Suppose that X and X are independent rv s with means 2 and 4 kips respectively and standard devia tions 5 and 1 0 kip respectively If a 5 ft and o 10 ft what is the expected bending moment and what is the standard deviation of the bending b If X and X are normally distributed what is the probability that the bending moment will exceed c Suppose the positions of the two loads are random variables De oting them by A and A assume that these variables have means of 5 and 10 ft respec uvely that each has a standard deviation of 5 and that all A s and X s are independent of one another What is the expected moment now d For the situation of part c what is the variance of the bending moment e If the situation is as described in part a except that Com X X 5 so that the two loads are not inde pendent what is the variance of the bending
Statistics
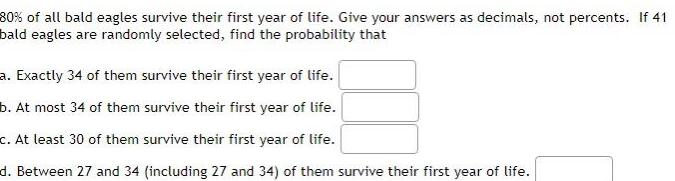
Probability80 of all bald eagles survive their first year of life Give your answers as decimals not percents If 41 bald eagles are randomly selected find the probability that a Exactly 34 of them survive their first year of life b At most 34 of them survive their first year of life c At least 30 of them survive their first year of life d Between 27 and 34 including 27 and 34 of them survive their first year of life
Statistics
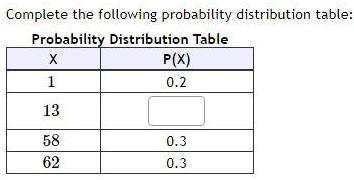
ProbabilityComplete the following probability distribution table Probability Distribution Table X 1 13 58 62 P X 0 2 0 3 0 3
Statistics
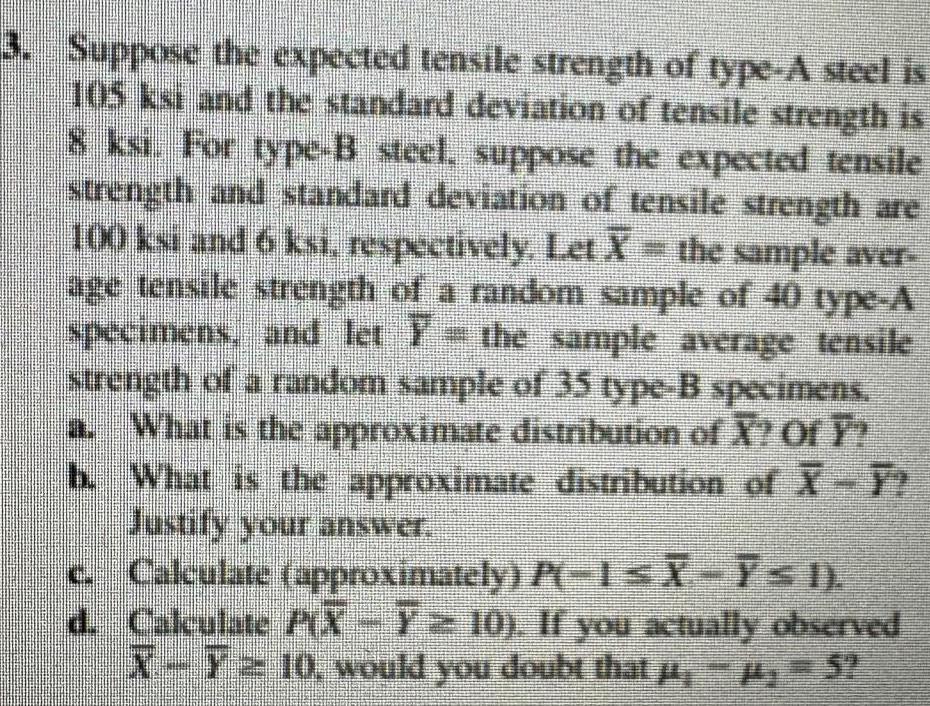
Probability3 Suppose the expected tensile strength of type A steel is 105 ksi and the standard deviation of tensile strength is 8 ksi For type B steel suppose the expected tensile strength and standard deviation of tensile strength are 100 ksi and 6 ksi respectively Let X the sample aver age tensile strength of a random sample of 40 type A specimens and let the sample average tensile strength of a random sample of 35 type B specimens a What is the approximate distribution of X Of Y What is the approximate distribution of X Y Justify your answer b c d S Calculate approximately P 1 X I Calculate PX 7 10 If you actually observed X T10 would you doubt that 5
Statistics
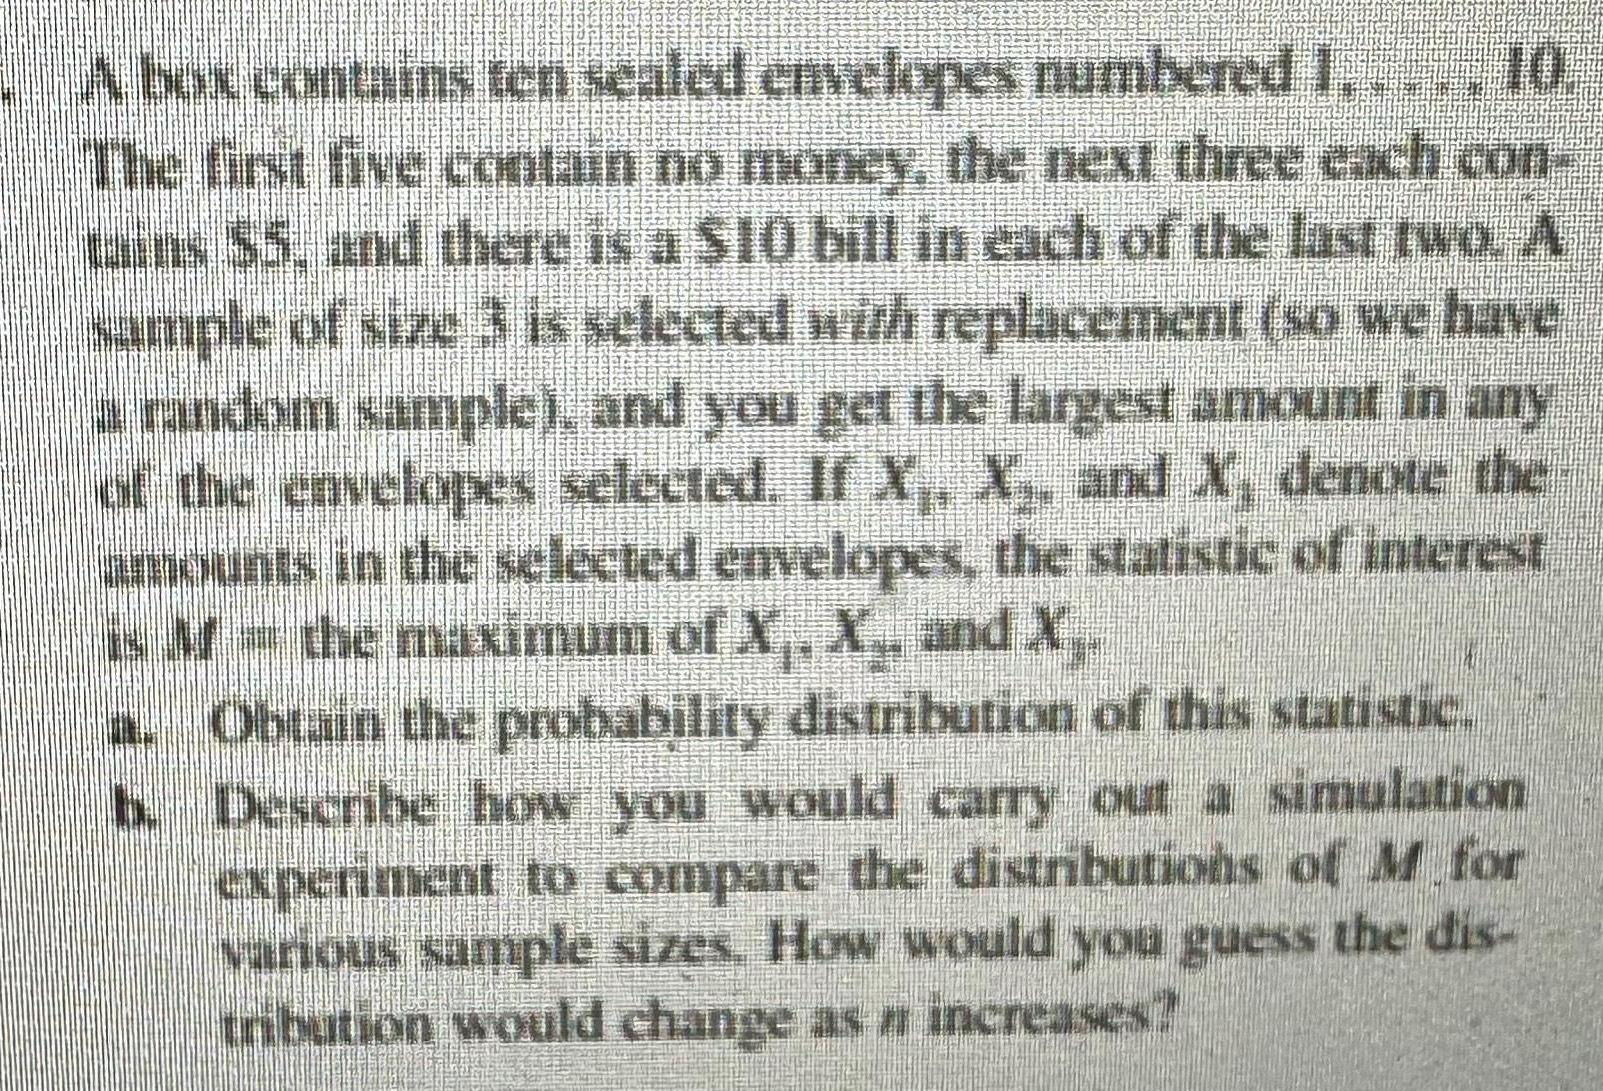
ProbabilityA box contains ten sealed envelopes numbered 1 10 The first five contain no money the next three each con tains 5 and there is a 10 bill in each of the last two A sample of size 3 is selected with replacement so we have a random sample and you get the largest amount in any of the envelopes selected If X X and X denote the amounts in the selected envelopes the statistic of interest is the maximum of X X and X NO Obtain the probability distribution of this statistic b Describe how you would carry out a simulation experiment to compare the distributions of M for various sample sizes How would you guess the dis tribution would change as n increases
Statistics
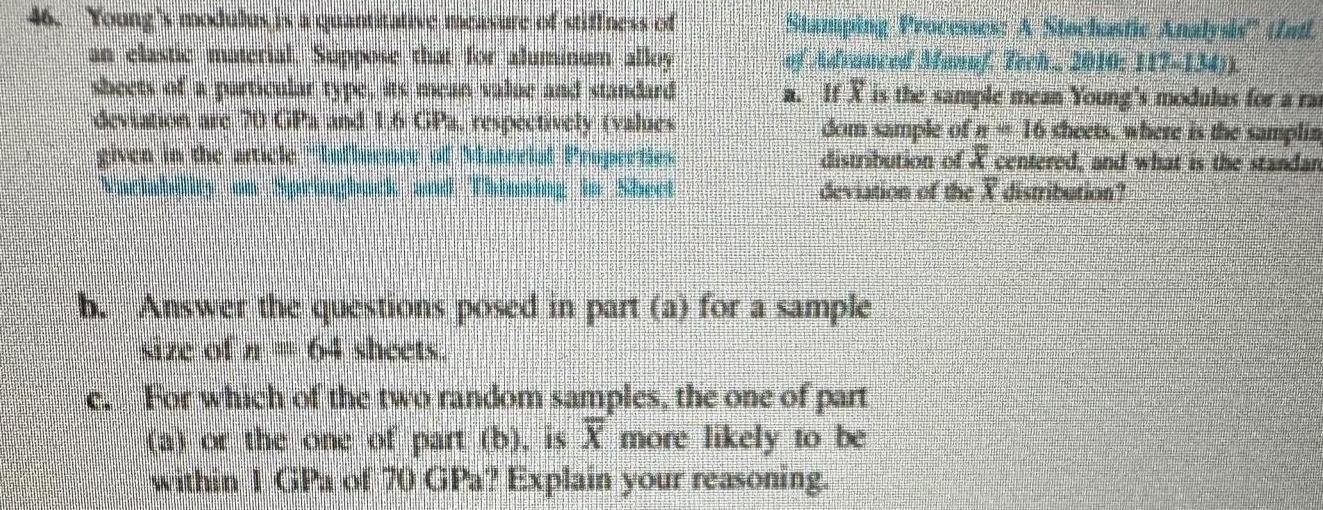
ProbabilityYoung s mes uws Ninwa UNUNG P Tessut NI TENA SIN DAL Makund 2016 GPL respectively values Stamping Processes Stockalic Anahir Unt And af fag Tamm 1010E DIT INT a It is the sample mean Young s modulas for a ran dom sample of a 16 sheets where is the samplin distribution of centered and what is the standard deviation of the distribution h Answer the questions posed in part a for a sample For which of the two random samples the one of part a or the one of part b is X more likely to be within 1 GPs of 70 GPa Explain your reasoning
Statistics
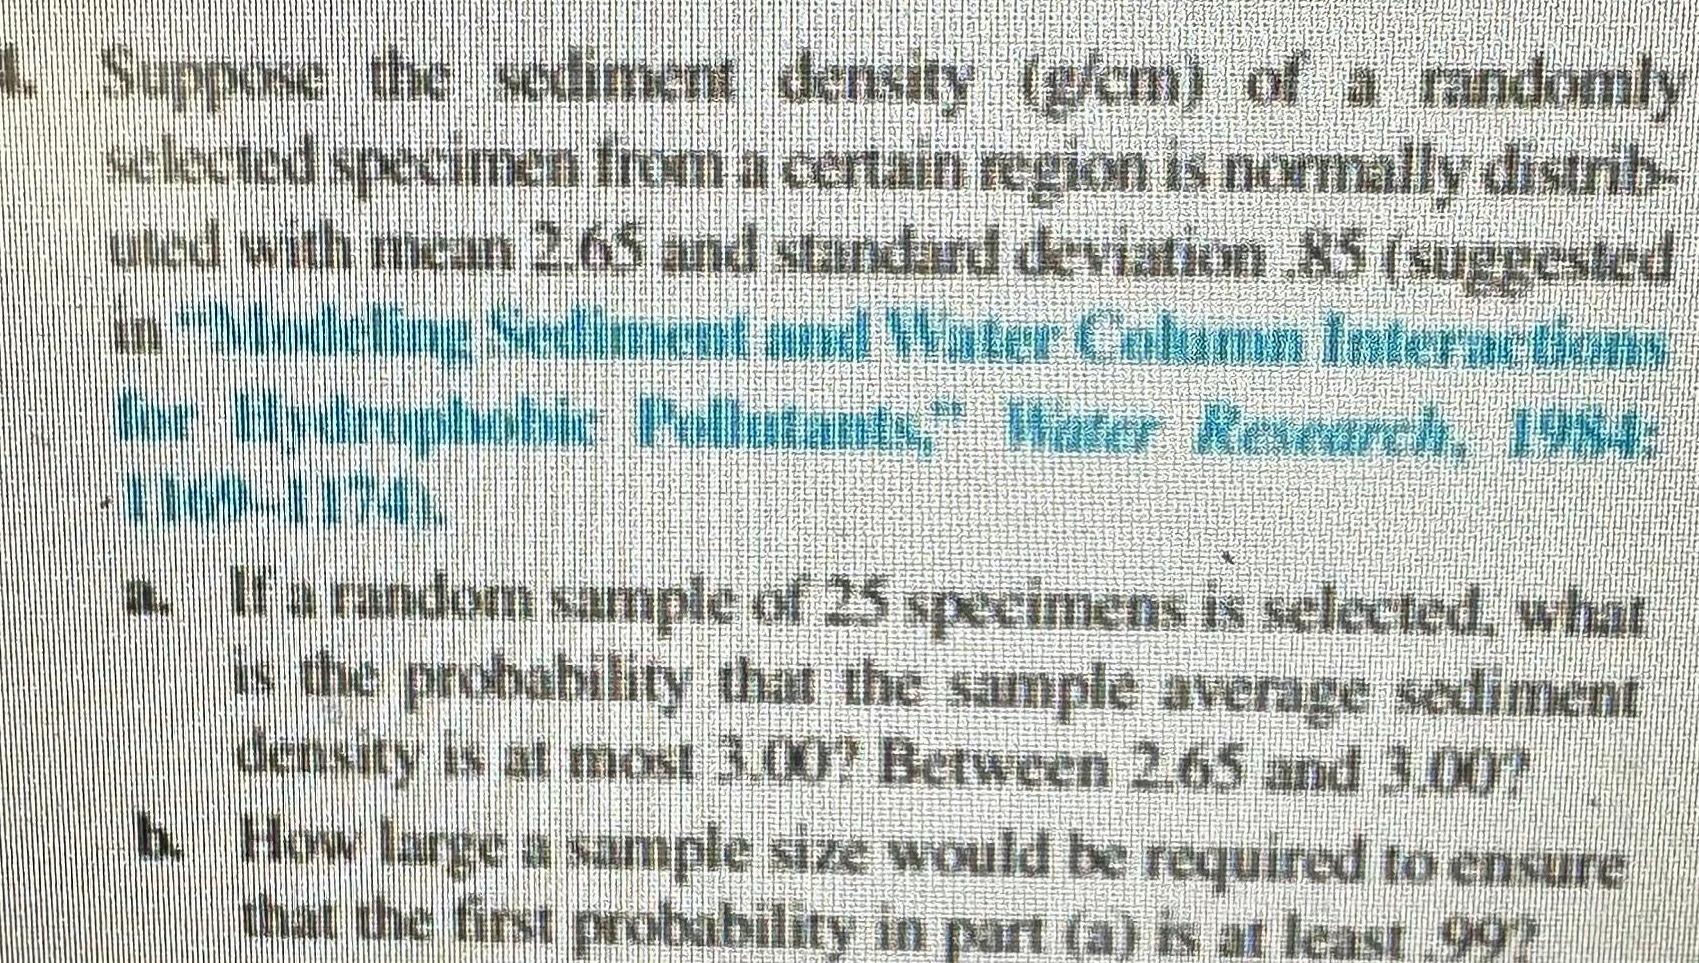
Probability4 Suppose the sediment density g cm of a randomly selected specimen from a certain region is normally distrib uted with mean 2 65 and standard deviation 85 suggested in Modeling Sediment and Water Column Interactions for Hydrophobic Pellutants Water Research 1984 a If a random sample of 25 specimens is selected what is the probability that the sample average sediment density is at most 3 00 Between 2 65 and 3 007 b How large a sample size would be required to ensure that the first probability in part a is at least 997
Statistics
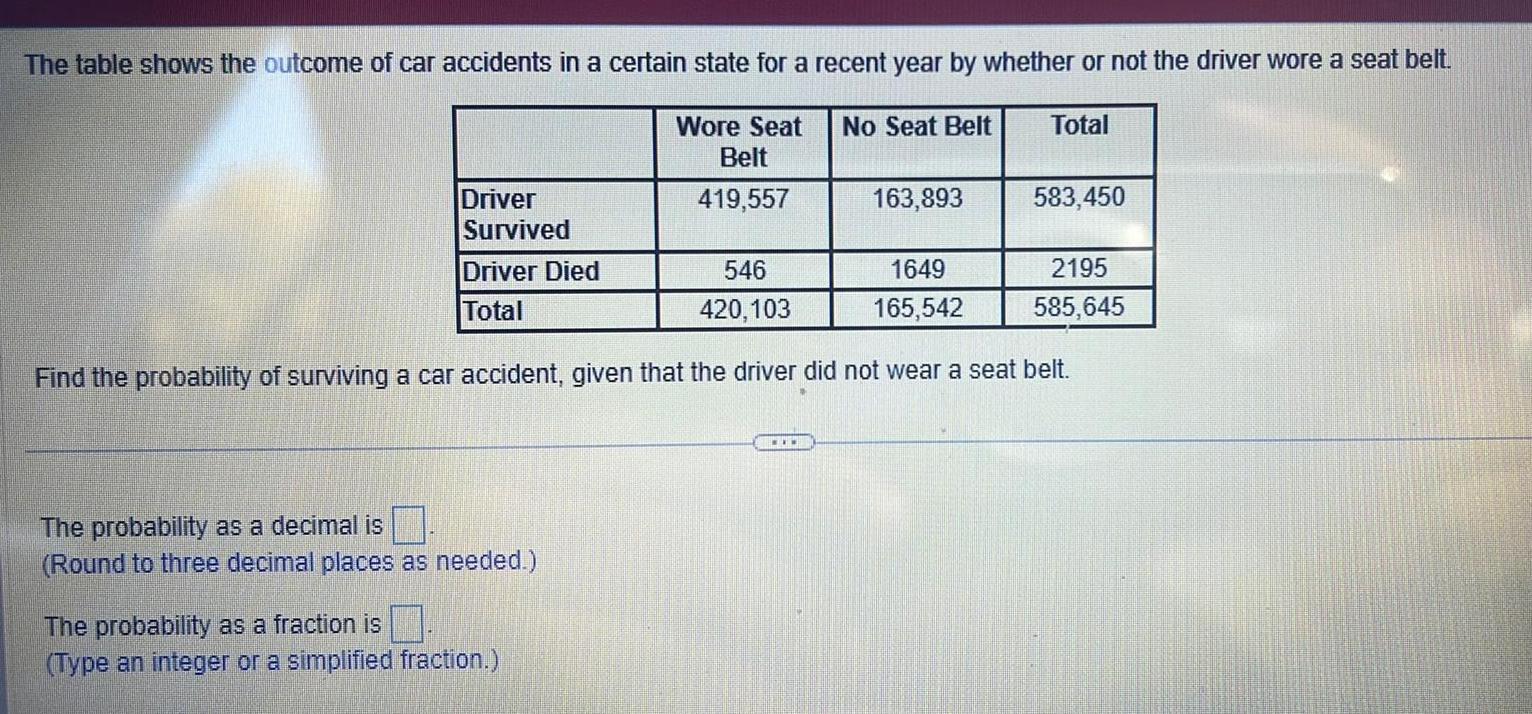
ProbabilityThe table shows the outcome of car accidents in a certain state for a recent year by whether or not the driver wore a seat belt Total Wore Seat Belt 419 557 Driver Survived Driver Died Total The probability as a decimal is Round to three decimal places as needed The probability as a fraction is Type an integer or a simplified fraction No Seat Belt 546 1649 420 103 165 542 Find the probability of surviving a car accident given that the driver did not wear a seat belt www 163 893 583 450 2195 585 645
Statistics
ProbabilityListen A factory produces plate glass with a mean thickness of 4mm and a standard deviation of 1 1mm A simple random sample of 100 sheets of glass is to be measured and the mean thickness of the 100 sheets is to be computed What is the probability that the average thickness of the 100 sheets is less than 4 07 mm Round your answers to 5 decimal places A
Statistics
ProbabilityA study was made of seat belt use among children who were involved in car crashes that caused them to be hospitalized It was found that children not wearing any restraints had hospital stays with a mean of 7 37 days and a standard deviation of 2 8 days with an approximately normal distribution Find the probability that their hospital stay is from 5 to 6 days rounded to five decimal places
Statistics
ProbabilityScenario B A pediatrician is interested in whether deep breathing can alleviate the distress that children experience when receiving routine vaccines during wellness checks She randomly assigns her 2 year old patients to either receive brief instructions on how to use deep breathing techniques or to receive no instruction prior to receiving routine vaccines She expects that the children who receive the deep breathing instruction will show less distress during the vaccines than the children who did not receive the instructions What is the null hypothesis for this scenario
Statistics
ProbabilityAn experiment is picking a card from a fair deck a What is the probability of picking a Jack Round answer to 3 decimal places 0 077 b What is the probability of picking a Jack given that the card is a face card Round answer to 3 decimal places c What is the probability of picking a face card given that the card is a Jack Round answer to 3 decimal places d Are the events Jack and face card independent events Why or why not Round answer to 3 decimal places Select an answer e What is the probability of picking a club Round answer to 3 decimal places f What is the probability of picking a club given that the card is a three Round answer to 3 decimal places What is LIN
Statistics
ProbabilityAn experiment is picking a card from a fair deck a What is the probability of picking a Jack Round answer to 3 decimal places b What is the probability of picking a Jack given that the card is a face card Round answer to 3 decimal places c What is the probability of picking a face card given that the card is a Jack Round answer to 3 decimal places I d Are the events Jack and face card independent events Why or why not Round answer to 3 decimal places Select an answer e What is the probability of picking a club Round answer to 3 decimal places f What is the probability of picking a club given that the card is a three Round answer to 3 decimal places g What is the probability of picking a three given that the card is a club Round answer to 3 decimal places
Statistics
ProbabilityAre the events you buying lunch from McDonalds and another randomly selected student buying lunch at McDonalds independent events Why or why not Yes because they can both happen at the same time Yes because they both cannot happen at the same time O No because the occurrence or nonoccurrence of one of them affects the probability of the occurrence of the other event Yes because the occurrence or nonoccurrence of one of them does not affect the probability of the occurrence of the other event O No because they both cannot happen at the same time O No because they can both happen at the same time O No because the occurrence or nonoccurrence of one of them does not affect the probability of the occurrence of the other event Yes because the occurrence or nonoccurrence of one of them affects the probability of the occurrence of the other event

Statistics
Probabilityb What is the probability that a survivor was in the 3rd class Round final answer to 3 decimal places 0 262 c What is the probability that a survivor was a female given that the person was in 3rd class Round final answer to 3 decimal places 0 800 d What is the probability that a survivor was a female and in the 3rd class Round final answer to 3 decimal places 0 208 e What is the probability that a survivor was a female or in the 3rd class Round final answer to 3 decimal places Q 0 736 f Are the events survivor is a female and survivor is in 3rd class mutually exclusive Why or why r Select an answer g Are the events survivor is a female and survivor is in 3rd class independent Select an answer Yes because P female and 3rd class 0 No because P female and 3rd class 0 Yes because P female and 3rd class is not equal to 0 No because P female and 3rd class is not equal to 0 Yes because P female or 3rd class 0 No because P female or 3rd class 0 Yes because P female 3rd class P female No because P female 3rd class is not equal to P female Yes because P female 3rd class P 3rd class locc is not equal to R 3rd class Post to forum