Probability Questions and Answers

Statistics
ProbabilityUse a graphing calculator to graph the normal probability density function f x 1 o 2 H 400 and the standard deviation 200 Choose the correct graph below O A 0 800 100 by 0 0 03 0 002 5 OB 600 1000 100 by 0 0 03 0 002 Q S O C 0 800 100 by 0 0 004 0 0002 Q Q e x 20 O D that has the mean Q Q n 600 1000 100 by 0 0 001 0 0001 5

Statistics
Probabilitya 0 7 3 1 0 a 1 2 a 2 0 03 1 1 a 0 9 Suppose that the system shown in the above figure consists of parts whose time to failure has a pdf given by 9 3 1 20 20 with a given Calculate the probability that the system is functioning at time t 3

Statistics
ProbabilityClearly and neatly show all work for each problem Round all final answers to the nearest dollar Do not round intermediate work 1 Velma currently has a job that pays her 48 000 a year She is paid twice a month on the 5th and the 20th and wants to start saving for retirement and pay off her credit card Velma plans to contribute 7 5 of her pre tax income to her company s 401k Find how much of each paycheck Velma will be putting into the 401k If the 401k is compounded semi monthly at a rate of 3 2 find the balance in 30 years when Velma hopes to retire

Statistics
ProbabilityState the type of sample 1 A radio station asks to listeners to call in and give their opinion on the song just played 2 A Student selected books from each of the categories of Science fiction and history The number of pages in each book was identified 3 During the last presidential election CNN Conducted an exit poll at randomly Selected Polling station and all voters Were Surveyed as they left the premises when collecting data in a lake a researcher Stretches a rope across the lake and Collects Samples atevery interal of 5 meters To Testa New drug Subects were Trondmly selected to take part in

Statistics
ProbabilityFind the linear quadratic and logarithmic functions that best fit the data points 1 4 6 2 5 0 3 6 0 4 6 2 and 5 6 5 Which of the three functions best fits the data The linear function that best fits the data points is y 0 5x 4 16 Type an expression using x as the variable Use integers or decimals for any numbers in the expression Round to two decimal places as needed The quadratic function that best fits the data points is y Type an expression using x as the variable Use integers or decimals for any numbers in the expression Round to two decimal places as needed

Statistics
ProbabilityRegarding the previous question If it were later determined that it was important to be more than 95 confident and a new survey was commissioned how would that affect the minimum number you would need to survey Why

Statistics
ProbabilityTwo researchers Beth and Frank ask a random sample of teenagers whether or not they had been to the movies in the last month They find that their sample proportion p of teens who said yes was 8 80 When they construct a confidence interval based on this sample proportion Beth comes up with 73 87 while Frank gets 75 89 Indicate which interval has to be wrong and explain your choice

Statistics
Probability1 What is the difference between probability and odds Give an example of each 4 pts

Statistics
ProbabilityThere is statistically significant evidence to conclude that there is a correlation between the amount of time customers spend at the store and the amount of money that they spend at the store Thus the regression line is useful Round to two decimal places d 7 e Interpret There is a 77 chance that the regression line will be a good predictor for the amount of money spent at the store based on the time spent at the store Given any group that spends a fixed amount of time at the store 77 of all of those customers will spend the predicted amount of money at the store 77 of all customers will spend the average amount of money at the store O There is a large variation in the amount of money that customers spend at the store but if you only look at customers who spend a fixed amount of time at the store this variation on average is reduced by 77 f The equation of the linear regression line is y Please show your answers to two decimal places g Use the model to predict the amount of money spent by a customer who spends 14 minutes at the store Dollars spent Please round your answer to the nearest whole number h Interpret the slope of the regression line in the context of the question For every additional minute customers spend at the store they tend to spend on averge 4 04 more money at the store O The slope has no practical meaning since you cannot predict what any individual customer will spend As x goes up y goes up i Interpret the y intercept in the context of the question If a customer spends no time at the store then that customer will spend 6 51 The y intercept has no practical meaning for this study O The best prediction for a customer who doesn t spend any time at the store is that the customer will spend 6 51 The average amount of money spent is predicted to be 6 51

Statistics
Probabilityx c g o o d for letter in x message letter Consider the above code How many times will the loop iterat 08 07

Statistics
ProbabilityThe average American gets a haircut every 37 days Is the average different for college students The data below shows the results of a survey of 11 college students asking them how many days elapse between haircuts Assume that the distribution of the population is normal 30 41 29 24 34 38 32 28 34 25 34 What can be concluded at the the x 0 05 level of significance level of significance a For this study we should use Select an answer b The null and alternative hypotheses would be Ho Select an answer H Select an answer c The test statistic d The p value e The p value is a f Based on this we should Select an answer the null hypothesis g Thus the final conclusion is that please show your answer to 3 decimal places Please show your answer to 3 decimal places The data suggest the population mean is not significantly different from 37 at x 0 05 so there is sufficient evidence to conclude that the population mean number of days between haircuts for college students is equal to 37 The data suggest the populaton mean is significantly different from 37 at a 0 05 so there is sufficient evidence to conclude that the population mean number of days between haircuts for college students is different from 37 The data suggest the population mean number of days between haircuts for college students is not significantly different from 37 at a 0 05 so there is insufficient evidence to conclude that the population mean number of days between haircuts for college students is different from 37

Statistics
ProbabilityError in if condition missing value where TRUE FALSE needed Consider the above message Which of the following could be the value of condition inside the if statement Note this assumes you have R version 4 2 0 as per the syllabus O NaN O NA NA O NA

Statistics
ProbabilityWhat happens when the condition passed to an if statement is vector with length not equal to 1 Note this assumes you have R version 4 2 0 as per the syllabus O An error occurs The code executes with neither warning nor error O It depends on the condition in the if statement A warning occurs

Statistics
ProbabilityUse the Empirical Rule to answer the questions below The distribution of weights for newborn babies is approximately normally distributed with a mean of 7 6 pounds and a standard deviation of 0 8 pounds 1 What percent of newborn babies weigh more than 8 4 pounds 2 The middle 95 of newborn babies weigh between pounds 3 What percent of newborn babies weigh less than 6 pounds and 4 Approximately 50 of newborn babies weigh more than 5 What percent of newborn babies weigh between 6 8 and 10 pounds 196 pounds

Statistics
ProbabilityState the appropriate null and alternate hypotheses Ho o 3 H 0 This hypothesis test is a right tailed Part 1 5 Part 2 of 5 3 test Find the critical value Round the answer to three decimal places For g 0 05 the critical value in

Statistics
ProbabilityBabies A sample of 25 one year old girls had a mean weight of 24 1 pounds with a standard deviation of 4 3 pounds Assume that the population of weights is normally distributed A pediatrician claims that the standard deviation of the weights of one year old girls is greater than 3 pounds Do the data provide convincing evidence that the pediatrician s claim is true Use the a 0 05 level of significance Part 0 5 Part 1 of 5 State the appropriate null and alternate hypotheses H Choose one H 0 Choose one This hypothesis test is a Choose one test X 5 0

Statistics
ProbabilityA certain insecticide kills 50 of all insects in laboratory experiments A sample of 13 insects is exposed to the insecticide in a particular experiment What is the probability that exactly 5 insects will die Round your answer to fou decimal places

Statistics
ProbabilityAn economist wants to estimate the mean per capita income in thousands of dollars for a major city in California Suppose that the mean income is found to be 22 7 for a random sample of 183 people Assume the population standard deviation is known to be 6 3 Construct the 85 confidence interval for the mean per capita income in thousands of dollars Round your answers to one decimal place nswerHow to enter your answer opens in new window 2 Points Keyp Keyboard Shor

Statistics
ProbabilityThe mean points obtained in an aptitude examination is 103 points with a variance of 169 What is the probability that the mean of the sample would differ from the population mean by less than 2 8 points 63 exams are sampled Round your answer to four decimal places

Statistics
ProbabilityFind the value of z such that 0 03 of the area lies to the right of z Round your answer to two decimal places Answer 2 Points Keypa Keyboard Shortc If you would like to look up the value in a table select the table you want to view then either click the cell at the intersection of the row and column or use the arrow keys to find the appropriate cell in the table and select it using t Space key Note Selecting a cell will return the value associated with the column and row headers for that cell Normal Table 0 to z

Statistics
ProbabilityFor the given scenario determine the type of error that was made if any Hint Begin by determining the null and alternative hypotheses A software company states 10 as the improvement in students grades after using the software One student claims that the improvement in students grades after using the software is different from 10 The student conducts a hypothesis test and fails to reject the null hypothesis Assume that in reality the improvement in students grades after using the software is 15 Was an error made If so what type Answer 2 Points O No correct decision O Yes Type Il error Yes Type I error k Keyboard S

Statistics
ProbabilityConsider the following box plots for Data Set A and Data Set B 45 80 45 48 Answer 2 Points 50 50 53 55 55 57 58 60 60 65 Step 1 of 2 Which data set has the largest value 65 67 66 Data Set A 70 74 70 75 Data Set B 75 80 80 83 85 85 85 90 90 94 95 8 95 00 F Kel

Statistics
ProbabilityThe following bar graph shows the per capita personal incomes for six states in 2003 Use this bar graph to answer th questions Income in Dollars 40 000 32 000 24 000 16 000 8000 0 T Per Capita Personal Income by State for 2003 33332 26838 Washington Arizona 28783 Indiana State 24977 Utah 26252 Kentucky 28235 North Carolina

Statistics
ProbabilityA patient with cancer undergoes treatment that has an expected value of a 90 reduction in tumor size The patient s tumor is 100 mm wide Which statement is correct O The patient s tumor will be 10 mm wide at the end of treatment O The patient s tumor will be gone at the end of treatment The patient s tumor will be smaller at the end of treatment O The patient s tumor has a 90 chance of being gone at the end of treatment The patient s tumor will most likely decrease by the end of treatment

Statistics
ProbabilityAn engineer designed the following system to deliver signals from the 1 end to the 2 end The system contains 13 components all used for signal delivery As long as the signal can reach the 2 end the system is functional Assume that all components function independently The probability that each component is functional is listed in the table below Compute the probability that the system is functional A B 4 0 JET Component functioning 0 98 0 96 0 88 0 92 0 94 0 85 0 97 0 90 0 89 0 83 0 94 0 91 0 86 A B C D E F G H I Probability of K L M K 2

Statistics
ProbabilityConsider the following table of data Complete parts a though c below X y 1 2 3 0 98 1 05 0 95 4 1 04 a Calculate the correlation coefficient ror decimal rounded to four decimal places as needed

Statistics
ProbabilityWhich of the statements is not true about continuous probability distributions O The total area under the density curve must be exactly 1 OIX is a continuous random variable taking values between 0 and 500 then P X 200 P X 200 O There are no disjoint events in continuous probability models O The probability of any event is the area under the density curve over the range of values that make up the event

Statistics
Probabilitycompany claims that a fast food restaurant chain receives on average 24 pounds of meat on a daily basis The district manager of the restaurant chain decides to randomly sample 41 shipments from the company and finds a mean weight of 22 5 pounds with a standard deviation of 3 8 pounds Test at a 3 level of significance to determine whether or not the food distribution company sends less than they claim a Check all of the requirements that are satisfied random the distribution is normal since n 30 the distribution is normal since the a distribution is normal the distribution is normal since np 10 and nq 10 b Identify the null and alternative hypotheses Ho Select an answer 000 0 H Select an answer c What type of hypothesis test should you conduct left right or two tailed left tailed right tailed two tailed d Identify the appropriate significance level Make sure to enter your answer as a decimal 0 e Which calculator function should you use Select an answer f Find the test statistic Write the result below and be sure to round your final answer to two decimal places g Find the p value Enter your answer as a decimal not a percentage and round to 4 decimal places

Statistics
Probabilitymm missing probabilities Start 04 Check Clear Help E E Now we can use the tree above answer the original question If Hugo or any other player for that matter tests positive what is the probability that he uses steroi Answer P FE Check Clear Help I give up

Statistics
Probabilityow pretend you are tossing a coin 11 times and take X to be the total number of heads that come up There are then 2 1 2 048 possible outcomes HHHHHHHHHHH HHHHHHHHHHT HHHHHHHHHTH HHHHHHHHTHH HHHHHHHTHHH HHHHHHTHHHH HHHHHTHHHHH HHHHTHHHHHH HHHTHHHHHHH HHTHHHHHHHH HTHHHHHHHHH THHHHHHHHHH HTTTTTTTTTT THTTTTTTTTT TTHTTTTTTTT TTTHTTTTTTT TTTTHTTTTTT TTTTTHTTTTT TTTTTTHTTTT TTTTTTTHTTT TTTTTTTTHTT TTTTTTTTTHT TTTTTTTTTTH TTTTTTTTTTT Take X to be the total number of heads that come up The possible values of X are Separate the values with commas Now fill in the missing probabilities The other missing probabilities will appear when you correctly answer the question or press Do it x P X x 0 1 Check Clear Do it 2 3 4 5 6 7 8 9 10 11

Statistics
Probabilitynd the percentage of the total area under the standard normal curve between the following z scores z 1 40 and z 2 83

Statistics
ProbabilityThe number of on line Monday stock trades at OHaganStockTrades com a subsidiary of oHaganBooks com was measured for 50 Mondays in a row with the following results Stock trades 0 99 100 199 200 299 300 399 400 499 Number of Mondays 6 12 14 10 8 Thus for example there were between 300 and 399 trades on 10 of the 50 Mondays The measurement classes are the ranges 0 99 100 299 etc We would like X to measure the number of stock trades on a randomly selected Monday and then calculate its probability distribution Since we only have information for ranges of values we replace each measurement class by its rounded midpoint Let us take them one by one The midpoint of the 0 99 range is 0 99 59 5 which we round to 50 2 100 199 The midpoint of the 100 199 range is 2 Now continue in the same way to obtain the remaining values of X QUIZ 149 5 which we round to 150 Stock trades 50 Number of Mondays 6 Now use the above frequency table to complete the estimated probability distribution of X 150 12 250 14 350 10 450 8

Statistics
ProbabilityA survey of randomly selected shopping malls yields the following data on the number of movie screens they contain 1 3 0 3 3 4 Movie screens Number of malls x Take X to be the number of movie screens in a selected mall so the values of X are given in the top row of the chart The frequencies are then the numbers in the second row For instance we observed X 0 no movie screens a total of 3 times as 3 of the malls had no movie screens So we rewrite the table as follows P X x 0 1 X 2 Check Clear 0 3 3 The experiment was performed a total of times Check Clear I give up To obtain the probability distribution divide each frequency by the total number of times the experiment was performed Do it 1 3 Frequency Think of the survey as repetitions of an experiment in which a mall is selected at random without replacement and the value of X is measured the number of screens 4 2 4 2 4 5 3 4 4 3 4 3 5 3 5 3

Statistics
ProbabilitySeveral gamers were asked if they liked playing real time strategy RTS or role playing RPG games The results of the survey are shown in the Venn Diagram below RPG 0 17 0 68 0 83 14 8 What is the probability that a randomly selected person from this survey does not like playing RPG games 0 57 6 RTS 18

Statistics
Probabilitya A computer randomly chooses a customer s phone number and a customer service rep calls to survey the customer b Customers are grouped by their zip code A few people for each zip code are surveyed QUESTION 18 Mike s pizza company is searching for a new specialty pizza to add to their menu Five specialty pizzas are on the ballot and the cashier polls every 20th customer that orders a pizza What type of sampling methe Cluster Sampling Convenience Sampling Stratified Random Sampling O Systematic Sampling QUESTION 19 A farmer is researching the effectiveness of a pest control spray He divides his orchard into 5 sections He then inspects all the trees within 2 of those sections What type of sampling method is he using

Statistics
Probability3 Cole and Collin polled 1256 students at CassTech as to which video games were the best The results are shown in the pie chart to the right Fill out the table and determine the CTs and range Game COD SM 3D P REV M F Percent Frequency 4 What advantages are there to Stem Leaf plots Super Mario 3D Pokeman Call of Duty 85 100 32 73 30 40 Village Fortnite R E Minecraft

Statistics
Probability1 point This is a list of things the average Canadian family uses Here are the quantities and prices for these items in 2001 and 2022 Item Milk litres Toothpaste tubes Socks Netflix 2001 Quantity 2001 Price 2022 Quantity 2022 Price 420 1 25 400 1 95 13 2 00 11 3 25 12 2 50 13 3 50 n a n a 12 15 00 Calculate the Canadian Family Price Index for 2022 2001 100 answer

Statistics
ProbabilityCalculate the mode mean and median of the following data Mode Mean Median 30 26 32 24 27 30 30 34 Note You can earn partial credit on this problem

Statistics
ProbabilityAt least one of the answers above is NOT correct Consider the following data set Below is a partially completed stem and leaf diagram for this data set 41 36 39 14 54 15 51 39 25 52 38 12 49 27 12 20 25 25 Note In order to get credit for this problem all answers must be correct Depuis 150 Determine the correct values for the missing entries and fill them in If no value is needed for a given entry then enter X Submit Answers L 3 19

Statistics
Probability1 point I bought my first car in 1992 for 4100 dollars In 2018 my daughter bought her first car for 5500 dollars What was the equivalent value of her car in 1992 dollars The CPI in 1992 was 86 3 and the CPI in 2018 was 133 4 Answer
Statistics
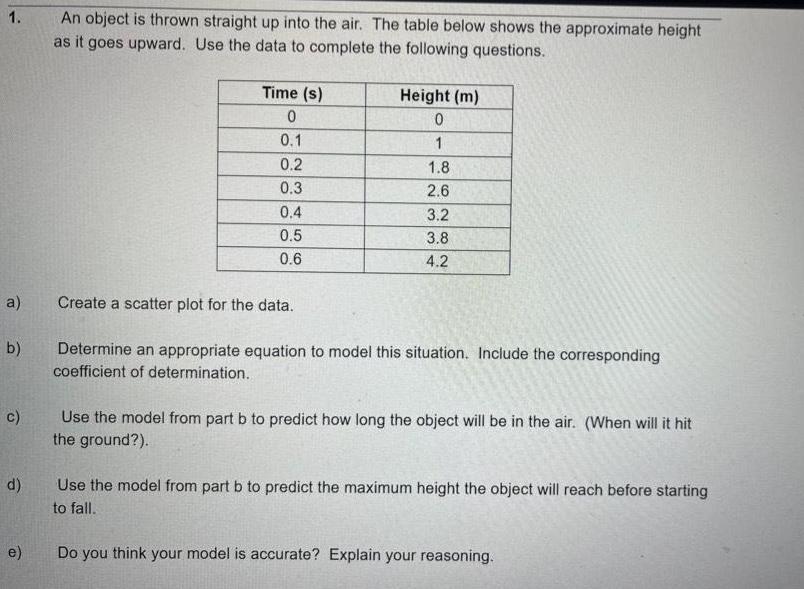
Probability1 a b c d e An object is thrown straight up into the air The table below shows the approximate height as it goes upward Use the data to complete the following questions Time s 0 0 1 0 2 0 3 0 4 0 5 0 6 Height m 0 1 1 8 2 6 3 2 3 8 4 2 Create a scatter plot for the data Determine an appropriate equation to model this situation Include the corresponding coefficient of determination Use the model from part b to predict how long the object will be in the air When will it hit the ground Use the model from part b to predict the maximum height the object will reach before starting to fall Do you think your model is accurate Explain your reasoning
Statistics
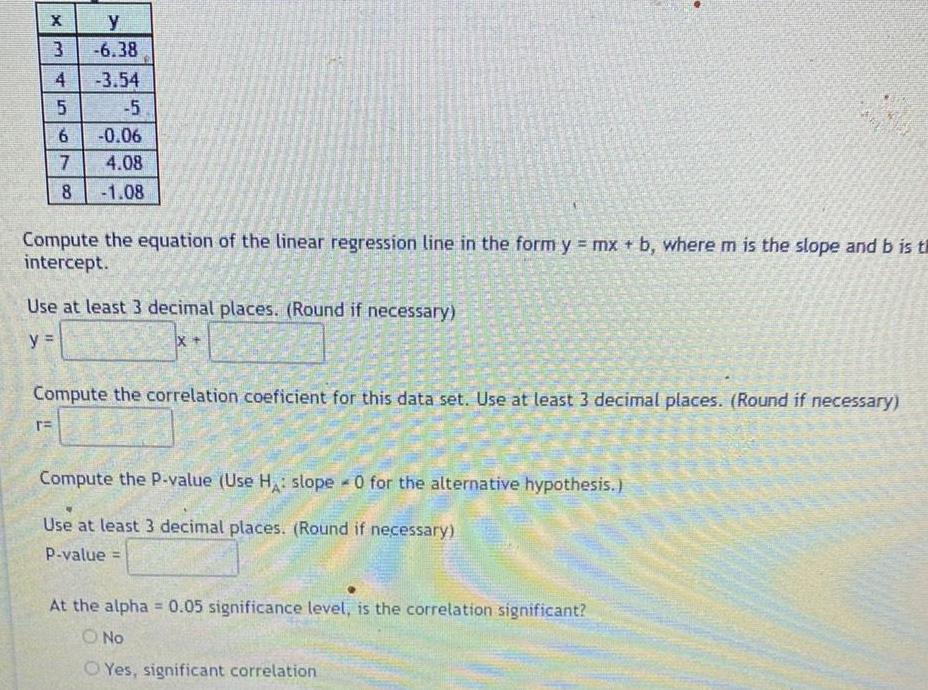
Probabilityy 3 6 38 3 54 5 6 0 06 7 4 08 8 1 08 EX 4 TE 45 Compute the equation of the linear regression line in the form y mx b where m is the slope and b is th intercept Use at least 3 decimal places Round if necessary y IX Compute the correlation coeficient for this data set Use at least 3 decimal places Round if necessary Compute the P value Use H slope 0 for the alternative hypothesis A Use at least 3 decimal places Round if necessary P value At the alpha 0 05 significance level is the correlation significant O No Yes significant correlation
Statistics
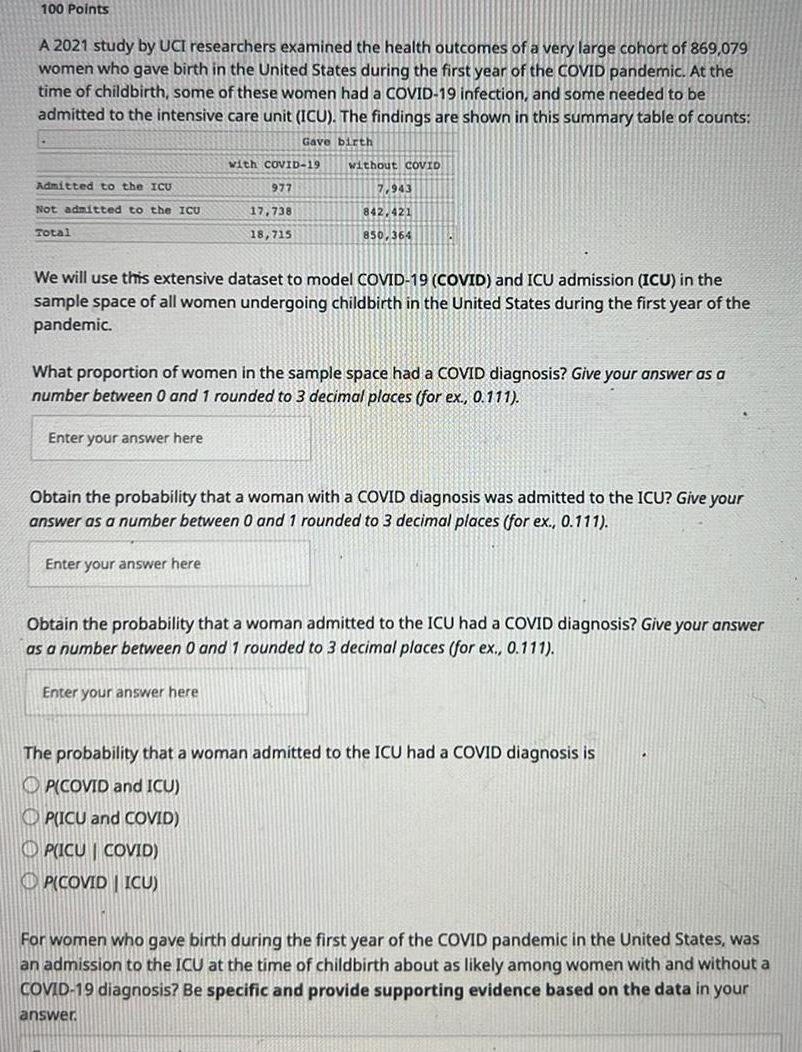
Probability100 Points A 2021 study by UCI researchers examined the health outcomes of a very large cohort of 869 079 women who gave birth in the United States during the first year of the COVID pandemic At the time of childbirth some of these women had a COVID 19 infection and some needed to be admitted to the intensive care unit ICU The findings are shown in this summary table of counts Gave birth Admitted to the ICU Not admitted to the ICU Total with COVID 19 Enter your answer here 977 17 738 18 715 without coVID We will use this extensive dataset to model COVID 19 COVID and ICU admission ICU in the sample space of all women undergoing childbirth in the United States during the first year of the pandemic Enter your answer here 7 943 842 421 850 364 What proportion of women in the sample space had a COVID diagnosis Give your answer as a number between 0 and 1 rounded to 3 decimal places for ex 0 111 Obtain the probability that a woman with a COVID diagnosis was admitted to the ICU Give your answer as a number between 0 and 1 rounded to 3 decimal places for ex 0 111 Enter your answer here Obtain the probability that a woman admitted to the ICU had a COVID diagnosis Give your answer as a number between 0 and 1 rounded to 3 decimal places for ex 0 111 The probability that a woman admitted to the ICU had a COVID diagnosis is OP COVID and ICU OP ICU and COVID P ICU COVID PICOVIDICU For women who gave birth during the first year of the COVID pandemic in the United States was an admission to the ICU at the time of childbirth about as likely among women with and without a COVID 19 diagnosis Be specific and provide supporting evidence based on the data in your answer
Statistics
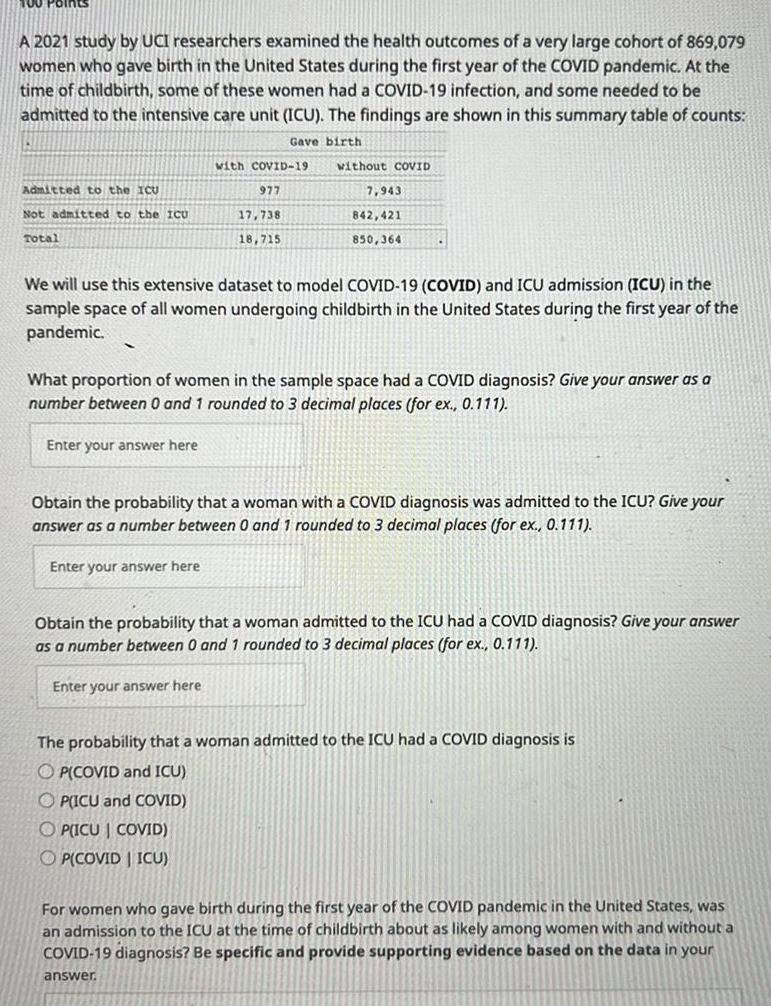
ProbabilityA 2021 study by UCI researchers examined the health outcomes of a very large cohort of 869 079 women who gave birth in the United States during the first year of the COVID pandemic At the time of childbirth some of these women had a COVID 19 infection and some needed to be admitted to the intensive care unit ICU The findings are shown in this summary table of counts Gave birth Admitted to the ICU Not admitted to the ICU Total with COVID 19 977 Enter your answer here 17 738 18 715 without COVID 7 943 842 421 850 364 We will use this extensive dataset to model COVID 19 COVID and ICU admission ICU in the sample space of all women undergoing childbirth in the United States during the first year of the pandemic What proportion of women in the sample space had a COVID diagnosis Give your answer as a number between 0 and 1 rounded to 3 decimal places for ex 0 111 Obtain the probability that a woman with a COVID diagnosis was admitted to the ICU Give your answer as a number between 0 and 1 rounded to 3 decimal places for ex 0 111 Enter your answer here Obtain the probability that a woman admitted to the ICU had a COVID diagnosis Give your answer as a number between 0 and 1 rounded to 3 decimal places for ex 0 111 Enter your answer here The probability that a woman admitted to the ICU had a COVID diagnosis is OP COVID and ICU OP ICU and COVID OPICU COVID OP COVID ICU For women who gave birth during the first year of the COVID pandemic in the United States was an admission to the ICU at the time of childbirth about as likely among women with and without a COVID 19 diagnosis Be specific and provide supporting evidence based on the data in your answer
Statistics
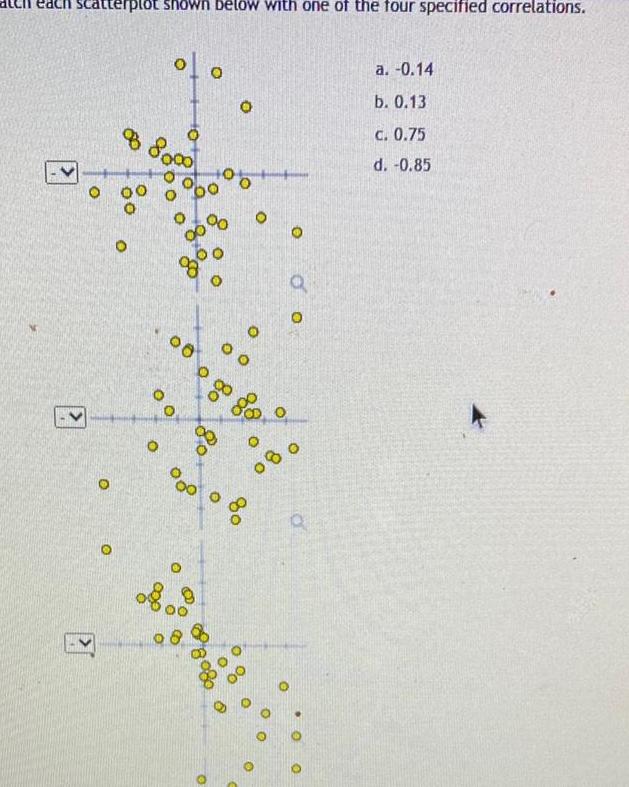
Probabilityach scatterplot shown below with one of the four specified correlations O O 8 8000 0 O 00 of o 0 0 00 00 00 08 0 00 O O O 80 O 00 O O 080 O Q O O Q O a 0 14 b 0 13 c 0 75 d 0 85
Statistics
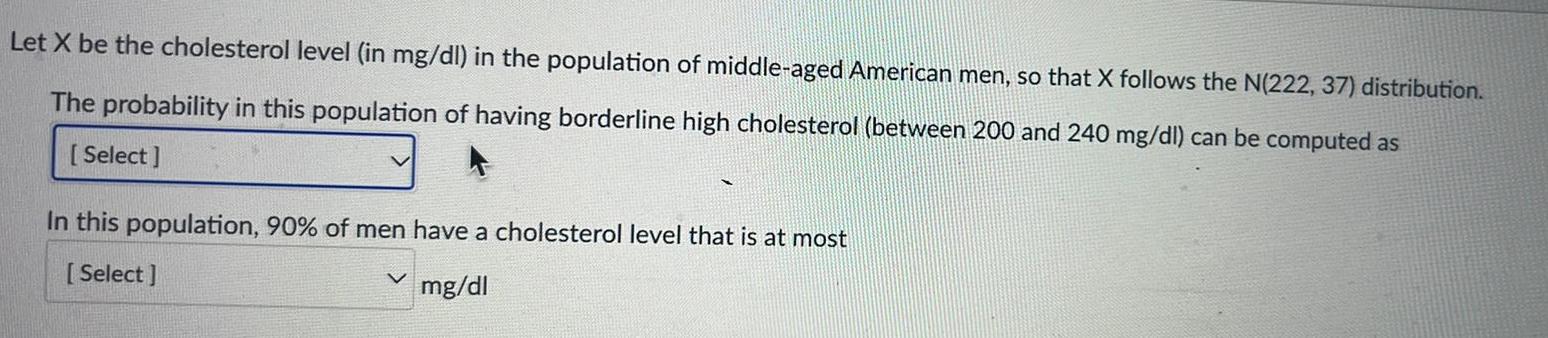
ProbabilityLet X be the cholesterol level in mg dl in the population of middle aged American men so that X follows the N 222 37 distribution The probability in this population of having borderline high cholesterol between 200 and 240 mg dl can be computed as Select In this population 90 of men have a cholesterol level that is at most Select mg dl V
Statistics
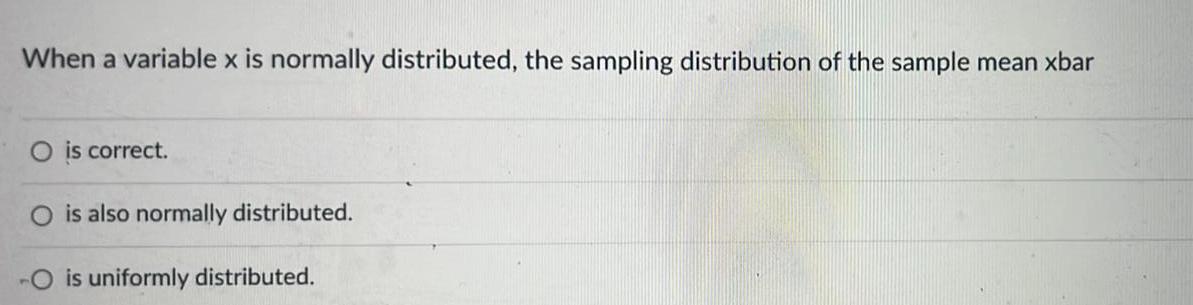
ProbabilityWhen a variable x is normally distributed the sampling distribution of the sample mean xbar O is correct O is also normally distributed O is uniformly distributed
Statistics
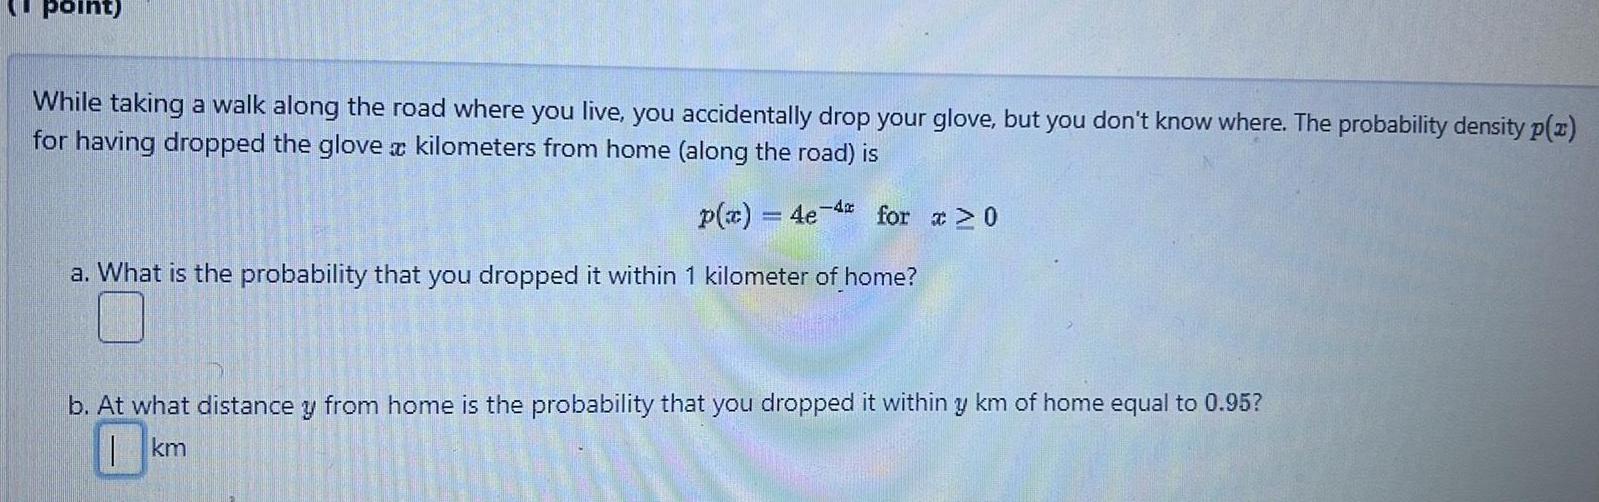
Probabilitypoint While taking a walk along the road where you live you accidentally drop your glove but you don t know where The probability density p x for having dropped the glove a kilometers from home along the road is p x 4e 4 for x 0 a What is the probability that you dropped it within 1 kilometer of home b At what distance y from home is the probability that you dropped it within y km of home equal to 0 95 km
Statistics
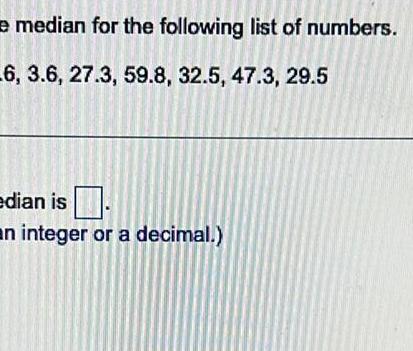
Probabilitye median for the following list of numbers 6 3 6 27 3 59 8 32 5 47 3 29 5 edian is an integer or a decimal

Statistics
Probabilityhe acreage in thousands of acres of the 39 U S National Parks is shown here Construct a frequency distribution for the data sing eight classes 41 36 183 520 650 505 196 760 66 338 61 77 462 94 70 143 233 775 233 236 13 308 27 217 106 52 75 265 132 28 46 539 169 64 77 5 52 402 220